LockedAndLoaded
PremiumRepeat after me: A simple chart a day is all you need for great TA! Need I say more? Included volume data and RSI if you needed more confluence. LL on RSI confirming what's in PA. This isn't financial advice y'all
The ascending triangle pattern is obvious as day. Price action has broken out and the triangle's already been tested from the top. Soon TRON will go on price discovery. The target of such ascending triangle is the height of the base of the triangle. I'm a bit conservative so my TP is $8 bucks. Don't be angry at me please. I don't make the rules. And this isn't...
TRX has made a strong move. It's consolidated nicely and is peaking out of the falling wedge. Things are looking great so far.
I haven't seen such TA here on TV before. I thought it's interesting and amusing if TA and TP on Bitcoin is this simple. This is comedy and certainly NFA
I'm going to link to my previous DASH idea where I was patiently awaiting DASH to leave the bullish falling wedge, re-test it from the top, and then fly off. But it turns out I was WRONG. DASH has already left the station for its next parabolic move. Here's a slightly different way of charting the falling wedge. It's valid too! The difference is that the B wave...
The chart speaks for itself. A textbook rising wedge. This is NFA
It's quite the busy chart but it's all about confluences. And right now I'm seeing strong confluence, which is a vote of confidence for me. Bullish divergence with RSI signalling 5th wave completition (corrective) Falling wedge boundaries being respected RSI climbing slowly but surely Bounce off .786 fib retracement and making a HL (need to see HH...
TRON's PA is a thing of beauty. The HLs in HTF on the ascending triangle are aesthetically perfect. Price has been on the rise for a little less than two years. Sooner or later the god candles will print out.
I believe that this cycle's wave 1 and its correction are done. Wave 2 being a shallow correction at Fib 0.236 gives us some clues as to what to expect next. Here's why I believe Wave 1 and its corrective wave 2 are past us and how wave 3 has already begun. RSI bearish divergence (usually happens between the tops of wave 3 & 5 price action) Correction to a...
So VeChain corrected to Fib 0.618 and it's making a nice retest of the resistance, which it already broke, from the top. Overall this is looking real good!
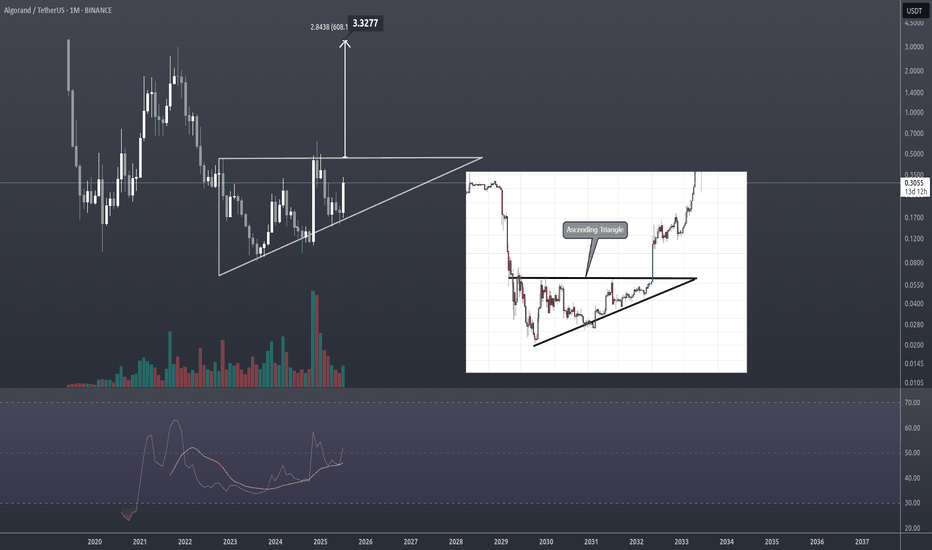
Algo is is gearing up to challenge its overhead resistance; the last one remaining in this cycle. I believe this will happen sometime in June/July. Things will ramp up suddenly after that.
BNB's pennant has been breached to the upside. Will the re-test confirm the move?
TRX has never held this strong compared to other bull runs. It's printed an interesting 3-year old bull flag. And if the price holds well above and retests with conviction, we could see the start of an impulsive wave next. TRX has historically been the punching bag of negative sentiment in crypto and that is changing. Justin Sun has recently embraced his bias and...
Lots of indecisiveness surrounding ARB. This is one of those moments, as a trader, where you can't rush into a trade. You have to let the market decide and then make a move to go with the flow. Symmetrical Triangle...Check HL on PA (so far)... Check LL RSI... Check! Poking of 55MA...Check! The close on the daily TF today will be key in forecasting what...
IOST PA exhibiting an interesting pattern when bottom. Chart speaks and so we listen! The bottom pattern is slightly smaller or less volatile than the last, which I believe is a sign of maturity (less manipulation). It's true that 5 is slightly more pronounced in the previous bottom but again most likely due to manipulation. So we can disregard the long wicks....
BNB has escaped its slump on the third attempt. It's now heading to $450 and there's nothing you can do to stop it. NFA!
The fib level 0.618 (0.001111) is an attractive target considering LTCBTC had significant reaction to the 0.5 fib level. This is the only explanation I can come up with as to why Litecoin wants to go this low with its strong fundamentals.
I think DASHUSD has found bottom and is about to embark on its next impulsive wave. Wave 3 is exactly 161.80% of wave 1, which is an amazing confluence! Wave 2 retraced to .618 (nice) but the next wave correct to 0.5-0.55 (with manip/fakeout) The multi-year downturn has formed a bullish wedge (RSI wedging too which is nice) Up & Onward I do think the price...


