MB2020MB2020
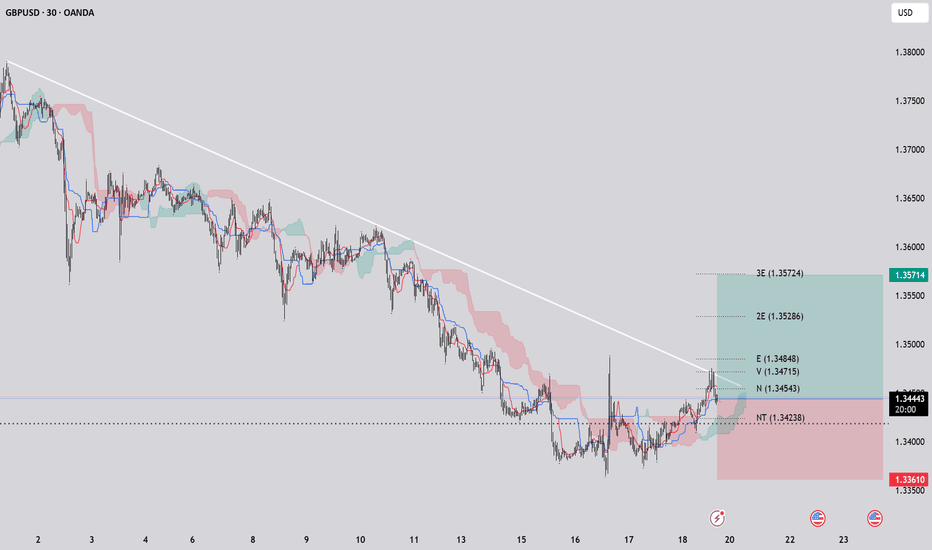
If the price breaks above the trendline, it could signal a reversal or a strong bullish momentum. In this scenario, the price may aim to test the nearest identified targets, which are marked as horizontal levels on the chart. These targets include zones around the upper boundaries of the shaded areas, potentially reaching the levels indicated by the upper...
On the 15-minute chart of NZDUSD, a shift in market structure is evident as the prior uptrend—previously supported by ascending trendlines—has been broken. The Ichimoku cloud (Kumo) outlines key support and resistance zones, and price movement outside the cloud reinforces the weakening of the bullish momentum. The crossover between the Tenkan-sen and Kijun-sen...
Break of Trend Line: The price has broken below a descending trend line, indicating a potential shift in momentum. Retest: After the break, the price appears to be retesting the trend line from below, which often acts as a confirmation of the breakout. Ichimoku Cloud: The price is interacting with the Ichimoku Cloud. A move above the cloud could signal a bullish...
The XMRUSDT 1-hour chart on TradingView shows a promising setup for a buy position. A clear trendline break and retest pattern is visible, with the price breaking above a descending trendline and retesting it as support before moving higher. Additionally, the wave structure supports the bullish outlook, forming an N-wave pattern—a key formation in Ichimoku wave...
The BTCUSDT 45-minute chart presents a promising setup for a buy position. A significant downtrend line has been broken, followed by a successful retest, suggesting a potential trend reversal. The Ichimoku Cloud reinforces this bullish outlook, with the price breaking above the cloud, indicating strengthening momentum. Additionally, the chart features a clear...
The AUDJPY H1 chart shows a compelling setup for a buy position. A clear downtrend line has been broken, followed by a successful retest, indicating a potential reversal. The Ichimoku Cloud supports this bullish outlook, with price action breaking above the cloud, signaling a shift to bullish momentum. Additionally, the chart highlights a Wave N formation, a key...
The price has recently broken above the Ichimoku cloud , indicating a potential bullish trend. Wave N patterns are identified, suggesting a corrective phase followed by a new upward wave, supporting a buy signal. The price is approaching resistance levels. The buy position could be considered with a target near the recent high of 2.11168, and a stop loss below...
The price, previously supported by ascending trendlines, has recently broken below these lines, signaling a potential reversal in momentum. The Ichimoku cloud (Kumo) highlights critical support and resistance zones, with the price moving outside the cloud, reinforcing the breakdown of the prior uptrend. The Tenkan-sen and Kijun-sen lines confirm this shift through...
If the price breaks above the trendline and consolidates above it, it could signal a potential buying opportunity. The consolidation above the trendline would indicate that the bearish momentum has weakened, and a bullish trend might be starting. Additionally, watch for the price to move back into the green Ichimoku Cloud to confirm the buy signal. Always...
The price action shows a clear break of a long-term ascending trendline, signaling a potential shift in momentum. This trend break aligns with the Ichimoku Cloud, where the price has moved below the cloud, indicating bearish sentiment. Additionally, the Ichimoku Wave theory suggests a corrective wave pattern, with the price testing key support zones after the...
Buy Setup: Price has broken the descending trendline and previous HH , confirming a bullish shift on H1 as of May 19, 2025. Currently in a pullback phase, finding support with Ichimoku showing bullish conditions—price above Kumo, Tenkan-sen above Kijun-sen, . Expecting continuation to the upside.
The price has reached a strong resistance zone, The Ichimoku Cloud also indicates overbought conditions, supporting a potential reversal. I’m targeting a move down to the support level at 1.12076, with a stop-loss above the recent high at 1.13000 for risk management. Let me know your thoughts!
Sell Setup: Price is trading below the Kumo on H1, confirming bearish dominance. Tenkan-sen has crossed below Kijun-sen, supported by Chikou Span lagging below price for additional confirmation. A bearish engulfing pattern formed at resistance level, reinforcing the sell signal.
Buy Setup: Price has successfully broken above the descending trendline, marking a shift from bearish to bullish momentum on the 1-hour timeframe as of May 19, 2025. The breakout is supported by higher highs forming, with the current pullback testing the broken trendline as potential support. Ichimoku conditions align with the bullish outlook—price is above the...
The price is nearing a key support area around 3,200–, which could act as a bounce point for a buy. Risk: The trend is currently bearish, so a buy here is counter-trend. If support fails, the price could drop to 3,180 . Wait for confirmation of a reversal before entering.
BTC is approaching a strong resistance zone at $106,000 after a recent uptrend. The price is near the upper boundary of the green zone ($102,000–$106,000), suggesting overbought conditions. Bearish signals: declining volume, overbought zone, and resistance at $106,000. Watch for a rejection at this level for confirmation.
Here I have SHIBUSDT on the 15m Chart SHIBUSDT may look pretty bullish we have strong levels , If the support is'nt broken, we can expect a BUY position
Here I have ETHUSDT on the 3H Chart ETHUSDT may look pretty bullish we have strong levels , If the support is'nt broken, we can expect a BUY position


