MESHANL
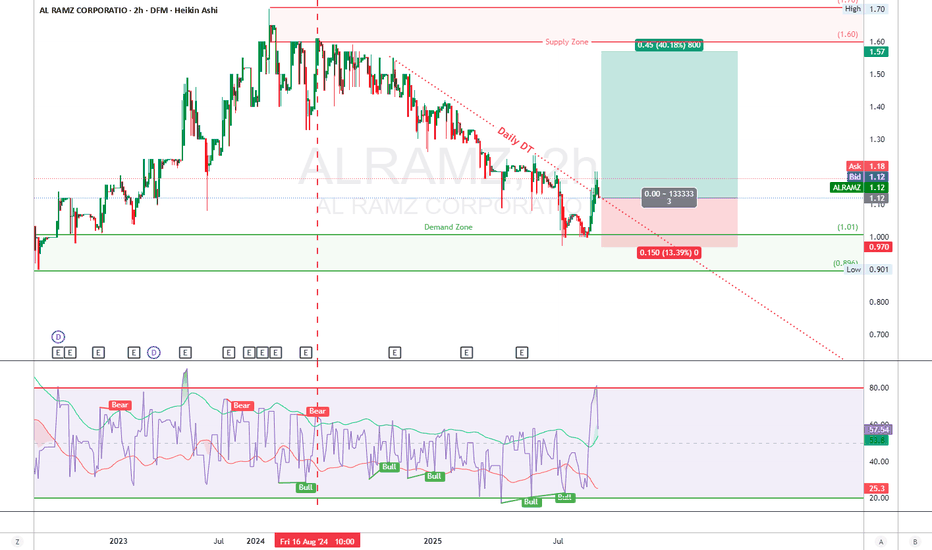
PremiumAL RAMZ CORPORATION (2H chart) ALRAMZ just threw down a textbook bounce off the demand zone, broke the daily downtrend line, and momentum's lit. That 1.57 level? That’s the kill zone. Could be Wave A or 1 — either way, bulls are cookin'. Looks like we’ve completed a **corrective structure** post-Wave 5 top near 1.70. The impulsive drop into the **Demand Zone...
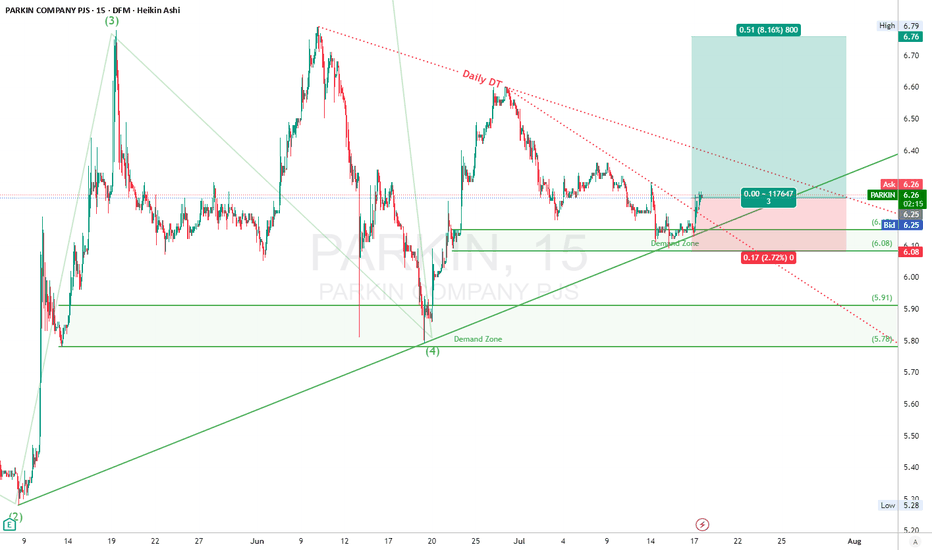
PARKIN had Impulsive breakout, confirmed by price piercing the descending Daily trendline (Daily DT) Double confirmation from the demand zone bounce and RSI bulls waking up. Trendline’s toast. If Wave 5 is truly kicking off, that 6.76 zone’s gonna be the magnet. Let it rip. Demand Zone :** 6.08–6.15 (held strong multiple times) Supply Zone:** 6.71–6.79 RSI...
“REIT just reclaimed the fair value zone after a deep correction. Wave 2’s in the rearview — now we’re primed to launch Wave 3. Smart money’s stacked at 0.44. 0.66 is the golden magnet if bulls keep structure intact.” 🧠 Elliott Wave Breakdown ✅ Completed bullish impulse (1 → 5), topping out near 0.59 🔻 Deep corrective decline (sharp ABC or Zigzag) down into...
"SALAM " (Al Salam Bank) Recently bounced from a Daily Demand Zone, and breaking the downward correction trend line. Buying Opportunity: The stock is currently at a discounted level and likely to resume the up trend again. Trade safe.. :)
TAQA just reset off that demand zone, carved out a clean Wave 2, and now revving for the Wave 3 engine. That 3.37 breakout could be the ignition — where the real fire starts. Clear impulsive move starting late June; we’re likely in a Wave (3) of a new bullish sequence. Wave (3) could extend toward 3.53–3.71 based on symmetry and momentum of previous wave. 🎯...
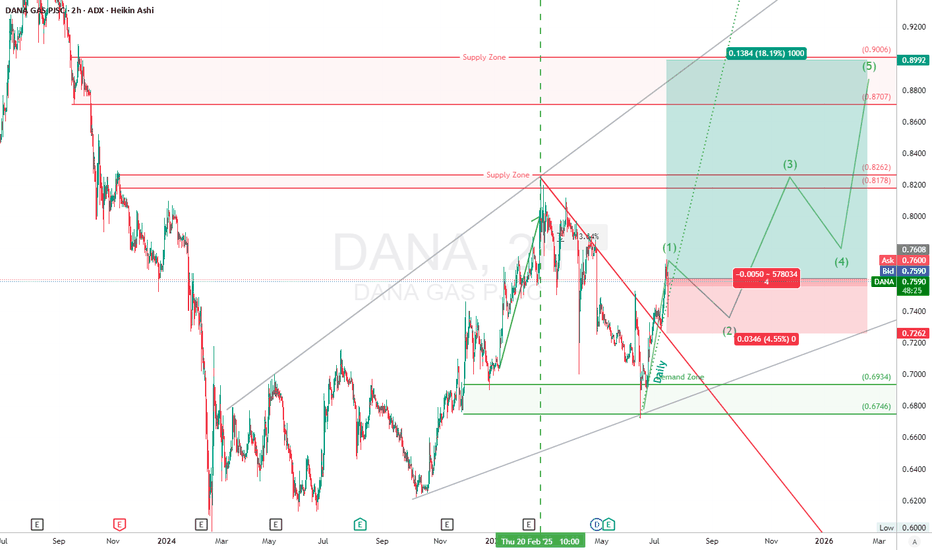
“DANA just nuked that downtrend line and tagged the demand zone with precision. Now we got that impulsive (1) and the pullback’s setting up like a textbook long. Eyes on the reload zone, ‘cause bulls could lift this to 0.90 in a 3-wave rocket.” 📈 Trade Setup – 2H (Timeframe) Wave & Structure Wave (1) of a new bullish 5-wave sequence has just completed. Current...
🏢 Company Overview Emirates Stallions Group is a major diversified holding company based in Abu Dhabi, UAE, and is part of the International Holding Company (IHC) 🔧 Core Business Manpower & Accommodation Solutions: Provides workforce management and labor supply (both skilled and unskilled) Develops and manages staff/workers accommodation via subsidiaries like...
🔥 BILDCO (ADX) – 2H Timeframe “BILDCO just dropped the hammer with that BOS confirmation. ABC correction’s done, accumulation is real. Bulls are loading. With structure flipping bullish and a clean Wave 3 setup in motion, this could rip hard to 1.30+.” Elliott Wave Breakdown: ✅ Completed ABC correction into Demand Zone 🔺 Wave (1) and (2) of new impulse appear...
Emirates REIT is bouncing off from a 2H demand zone and broke the downward trendline, with Bullish RSI Divergence. The stock had a sharp correction >30% and likely to start a new impulsive wave. Good time to enter the market or add to your position. Entry: 0.434 TP : 0.577 (4:1 RRR) SL: 0.396 Trade Safe!!
📈 Building a High-Yield Passive Income Portfolio with YieldMax ETFs 💰 YieldMax ETFs are redefining passive income by offering massive monthly distributions through options on high-volatility names like TSLA, MSTR, NVDA, and more. Below is a high-income ETF portfolio allocation tailored for strong yield, sector diversification, and long-term compounding...
🔥 LULU (ADX) – 1H Timeframe Lulu Retail Holdings PLC “LULU just cracked structure at 1.34 and flipped the script. The correction’s cooked, momentum’s shifting, and the bulls are looking to ride this wave straight into those stacked supply zones. Stops are tight, upside’s clean — this is where the move begins.” 🧠 Elliott Wave Breakdown 🔁 Wave (1) and (2) appear...
🔥 DUBAI ELECTRICITY (DEWA) “DEWA’s running a clean Elliott textbook: ABC down, new impulse up. The bulls stepped in hard at the C-wave low — textbook demand zone reaction. Now riding Wave 3 with momentum, and 3.06 is the magnet.” ### 🌀 **Elliott Wave Breakdown** * ✅ Completed impulse: Wave **(1)-(5)** topped near **2.90** * 🔻 Correction: **ABC** Zigzag down to...
### 🌀 **Elliott Wave Structure** * The stock completed a textbook 5-wave impulse (1 → 5). * Followed by a complex **ABCDE correction**, ending with a liquidity sweep on Wave (E). * Current price action is a **bullish breakout** — likely the start of a **new impulsive cycle**. ### 📐 **Fibonacci Extension Target** * **7.35 = 100% Fib extension** of previous...
DTC’s bouncing clean off the old resistance, now strong demand. Classic flip. Riding within an ascending channel, eyeing 2.75+ — just needs volume to push through ### 🟢 **Support Turned Demand Zone** * The **previous resistance zone** around **2.33 – 2.42** has flipped into a **strong support/demand zone**. * Price dipped into this zone and sharply bounced,...
📊 Trade Idea: UVIX Multi-Layered Entry Strategy (Scalping Volatility Spikes) The current market environment presents a unique opportunity to trade the Volatility Shares 2x Long VIX Futures ETF (UVIX), which has surged nearly 50% on Thursday and 124% over the last week. With ongoing fears surrounding President Trump's reciprocal tariffs, volatility is expected to...
📈 The NASDAQ 100 is currently trading at 18,075.00, which represents a -22.6% decline from the all-time high of 22,425.75 . This marks a significant drop from its peak, entering into what could be classified as a bear market by traditional standards. 📊The previous decline from the high of 16,800.00 in November 2021 saw a decline of 37.47% , eventually...
SIB have been in uptrend from November till now with outstanding financial performance ~26%, RSI is now below 50 so it is a good time to jump and hold the stock looking for further growth.
# **Dubai Financial Market (DFM) – A New Bull Cycle Emerging? 🚀📈** If you think that Dubai Stock Market has already had hits moment, think again - the real party is just about to begin! The Dubai Financial Market (DFM) has historically followed a **clear cyclical pattern**, with **three major market cycles** observed over the past two decades. - **Cycle 1...


