MIRZA_TRADS
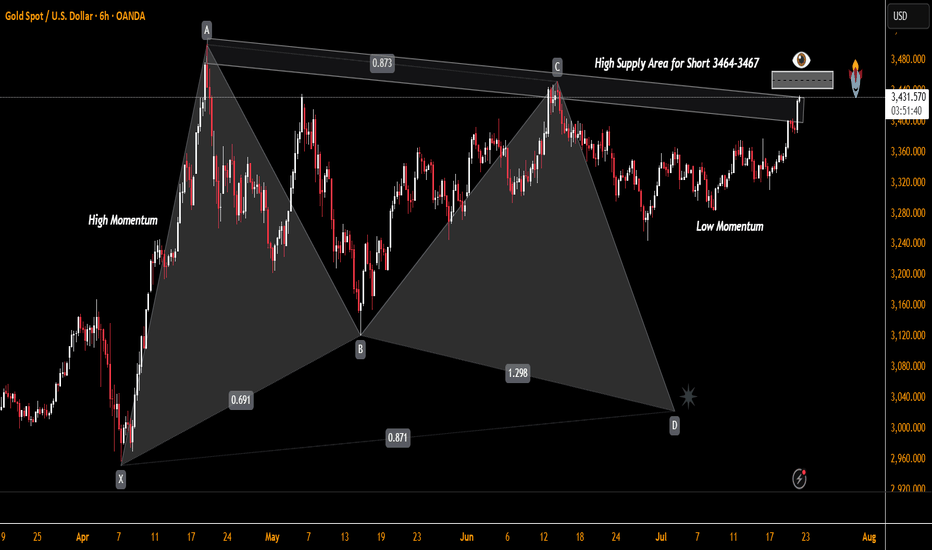
Gold is forming a bearish harmonic pattern near a key supply zone. Momentum is waning, suggesting a potential reversal setup.
Drop expected from current levels 3378-3383 toward the bottom of the channel area around 3156–3044.Sell Zone. Current region 3364 tight SL above upper channel. Buy Zone: 3045– 3060 Target: 3480 after reversal confirmation.
Strong bullish impulse 3300 to 3323 suggests buyers are stepping in. Prior bearish legs showed decreasing momentum, and the last drop failed to break the previous low sign of potential bullish divergence. Area to Watch If price breaks above 3345 with strong volume and closes above expect continuation toward 3370–3382 zone. If price fails to break above 3345...
The price has tested the resistance line multiple times showing strong supply/resistance. Buyers are gradually pushing price higher (higher lows), but momentum is weakening near resistance. This is a sign of consolidation under resistance pattern before breakout .Rising wedge typically breaks down signaling a potential drop, it confirms weakening momentum. Area...
At the top 1.1745, we see strong rejection wicks and bearish engulfing candles, hinting at exhaustion of buyers, Market entered sideways consolidation between 1.1680 and 1.1740, Price failed to break out of this range multiple times — forming a range-bound or distribution phase. The current bullish candle indicates a temporary relief rally after recent bearish...
Price entered sideways consolidation around June 24-25, After peaking around 0.6565–0.6580, the price started to create lower highs, suggesting a trend reversal or deeper correction.
A strong bullish trend, marked by a series of higher highs and higher lows. Price hits resistance around 1.37800 and fails to break higher. After that a range/consolidation forming with small candles between 1.37000 – 1.37800. Sellers start stepping in, and momentum shows weakens of the trend. Neutral to slightly bullish in the very short term due to the latest...
The recent price action shows lower highs and lower lows, indicating a bearish market structure. The latest move bounced slightly off the 98 level, suggesting it is being respected as support, further US attacked Iran called successful operation which in my opinion could give a boost to DXY . watch tightly ! TA BY MIRZA
Price is forming a lower high and starting to roll over , this suggests bearish pressure is creeping in, Recent candles are showing smaller bodies and long wicks, indicating indecision and a potential slowdown in bullish momentum. BTC could test support zones 92,000 and show short term pull back but major trend is bullish from 84k zone , buckle up and watch it tightly.
Price failed to break and hold above 111,000, forming a double top or potential lower high structure. Strong bearish drop from 111,000 to 103,500, showing momentum shift to the downside. Likely stop-hunt or liquidity grab below prior lows , Next move will depend on whether it breaks above 107k (bullish) or drops below 103k (bearish).
Price has been ranging between approximately 2500 and 2900 and the major trend is strongly bearish.Price recently attempted to break above previous highs but got rejected. Price is at a critical support level in a larger range structure. A break below 2500 could lead to a deep correction correction
Geopolitical tension raised between Iran & Israel which gives pump to gold so what do we expect now ? new highs of $3700 , $4000 or reversal ? in my opinion if gold doesn't breaks it's previous high with the body it might be a signal of LH & LL series. Area to watch for reversal : $3468 - $3482
The overall trend has been bearish with a series of lower highs and lower lows. Around 2.05 ,2.10, where price previously found support multiple times.Price formed a double bottom / higher low near 2.08, If rejected at 2.22–2.25 zone, price may revisit 2.10 or even 2.05.
The price has been making higher highs and higher lows since the March 2025 low. Maybe New all-time highs about to happen but i think it's trend reversal , Next week is important if price doesn't break the trendline resistance and show weakness then i believe it's trend reversal.
The price has been making lower highs and lower lows, especially from late May into early June, indicating sustained downward momentum. There is a small bullish pullback (seen in the last few candles), but no strong reversal confirmation yet if price action form BOS and invers H & S then we can expect a short term bullish trend reversal.
Are you going to buy Gold ? hold on then because the chart of 4-hour telling us a story of buy and sell. Market is in consolidation after a strong bullish move and trying to take below liquidity of major support 3040 – 3080 and i believe so this going to happen soon , further you can checkout the chart story and tell me what do you think ?
The chart at the 4hr formed H & S which is almost completed and resistance at 3360 (being tested now. Price is climbing with strong momentum if 3370-3380 breaks above may lead to re-test of 3480.If rejected Price may retrace toward 3320 , 3120 or even 3080 before attempting another push.
Price spiked up and then sharply rejected which indicated potential trend reversal or deep correction. But from where ? have a look.


