1st Vertical Line in bottom two charts show risk assets peaking such as Nasdaq and Bitcoin while the top two charts suggest a bottom confirmation by both US dollar and US 10 year treasury bills. Horizontal line shows major penetration of support and/or resistance for all four charts. Penetration to the upside for top 2 charts, while penetration to the downside...
1st Vertical Line in bottom two charts show risk assets peaking such as Nasdaq and Bitcoin while the top two charts suggest a bottom confirmation by both US dollar and US 10 year treasury bills. Horizontal line shows major penetration of support and/or resistance for all four charts. Penetration to the upside for top 2 charts, while penetration to the downside...
Audience: Trader Risk Amount: .05% to 1.5% Entry Price(s): 7100 Risk to Reward Ratio: 2.22 Publication: Free Analysis (Promotional) Author: www.MKSara.com Ticker: BTC Description: Bitcoin Type of Analysis: Technical Source of Analysis: Price Action 24 Hour Candlestick Trend Analysis: Downtrending Trend Velocity: Negative deceleration Current Price: 7142 3 Day...
Audience: Trader Risk Amount: .05% to 1.5% Entry Price(s): 8700 Risk to Reward Ratio: 2.5 Publication: Free Analysis (Promotional) Author: www.MKSara.com Ticker: BTC Description: Bitcoin Type of Analysis: Technical Source of Analysis: Price Action 2 Hour Candlestick Trend Analysis: Downtrending Trend Velocity: Negative acceleration Current Price: 8720...
Audience: Trader Risk Amount: .05% to 1.5% of portfolio Entry Price(s): 9200 Publication: Free Analysis (Promotional) Author: www.MKSara.com (website under construction) Ticker: BTC Description: Bitcoin Type of Analysis: Technical Source of Analysis: Price Action 2 Hour Candlestick Trend Analysis: Downtrending Trend Velocity: Negative acceleration ...
Audience: Trader Risk Amount: .05% to 1.5% Entry Price(s): 57 Publication: Free Analysis (Promotional) Author: www.MKSara.com Ticker: WTICOUSD Description: Wext Texas Intermediate Oil Futures Type of Analysis: Technical Source of Analysis: Price Action Daily Candlestick Trend Analysis: Consolidation Trend Velocity: Negative Acceleration Current Price: 57.053 5...
Audience: Trader Risk Amount: None. Notice served. Entry Price(s): None. Noticed served. Publication: Free Analysis (Promotional) Author: www.MKSara.com Ticker: BTC Description: Bitcoin Type of Analysis: Technical Source of Analysis: Price Action 2 Hour Candlestick Trend Analysis: Consolidation Trend Velocity: Pause of Negative acceleration with a possible...
Audience: Trader Risk Amount: .05% to 1.5% Entry Price(s): 8212 Publication: Free Analysis (Promotional) Author: www.MKSara.com Ticker: NAS100USD Description: Nasdaq 100 Futures Type of Analysis: Technical Source of Analysis: Price Action Daily Candlestick Trend Analysis: Consolidation Trend Velocity: Negative Acceleration Current Price: 8215.3 5 Day Forecast:...
Audience: Trader Risk Amount: .05% to 1.5% Entry Price(s): 1500 Publication: Free Analysis (Promotional) Author: www.MKSara.com Ticker: XAU Description: Gold Type of Analysis: Technical Source of Analysis: Price Action Daily Candlestick Trend Analysis: Consolidation Trend Velocity: Positive deceleration with a strong sign of Negative acceleration...
Audience: Global Macro Investor Risk Amount: None Entry Price(s): None Publication: Free Analysis (Promotional) Author: www.MKSara.com Ticker: BTC Description: Bitcoin Type of Analysis: Technical - Comparative Source of Analysis: Price Action on Daily Candlestick, SP500, VIX, BTC Conclusion: "Correlations correlate until they dont."
Audience: Trader Risk Amount: .05% to 1.5% Entry Price(s): 9275 Publication: Free Analysis (Promotional) Author: www.MKSara.com Ticker: BTC Description: Bitcoin Type of Analysis: Technical Source of Analysis: Price Action 2 Hour Candlestick Trend Analysis: Long Term Consolidation Trend Velocity: Positive Deceleration with a strong sign Negative...
Audience: Global Macro Investor Risk Amount: None Entry Price(s): None Publication: Free Analysis (Promotional) Author: www.MKSara.com Ticker: DXY Description: US Dollar Type of Analysis: Technical Source of Analysis: Price Action on Bi-Weekly Candlestick Trend Analysis: Up-trending with signs of consolidation based on price Trend Velocity: Positive Deceleration...
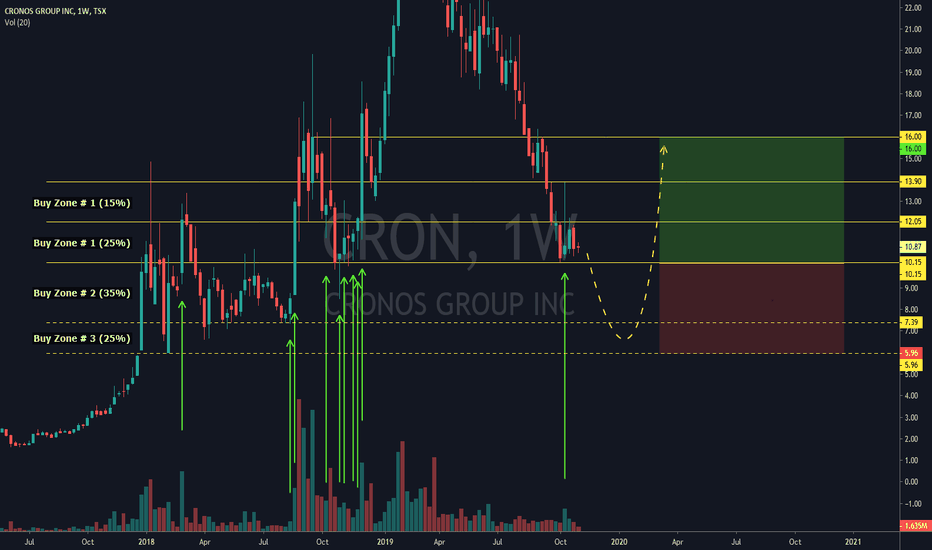
Audience: Investor Risk Amount: Position size should be max. 3% to 5% of portfolio total Entry Price(s): Multiple entries with a scaling strategy to average down or average up the net cost over 6 to 8 weeks. Publication: Free Analysis (Promotional) Author: www.MKSara.com Ticker: CRON Description: Cronos Group Type of Analysis: Technical Source of Analysis:...


