MMBTtrader
PremiumHi on this chart that may happen with more than 70% possibility we have one of the easy setups and strategy which i call it FAKEOUT&LIQUIDTY this happen usually near trendline support or range zone support or even resistance and after a possible fakeout usually market kick sellers or Buyers and then with high volume market reverse. I saw High volume and Fake...
As we can see the blue channel resistance is gone and also now it turn to strong and valid support and retest is also complete and gold is now targeting 3600$ easy. DISCLAIMER: ((trade based on your own decision)) <<press like👍 if you enjoy💚
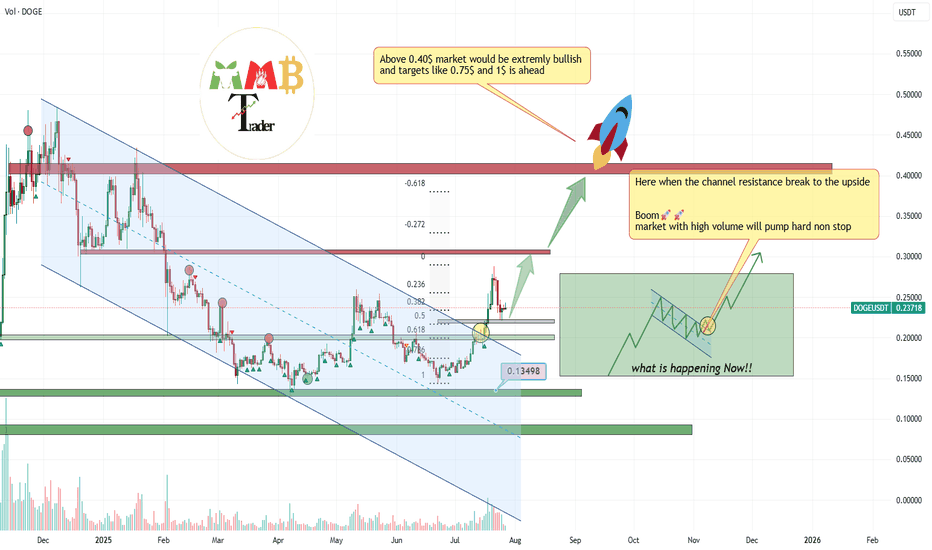
Those Fibonacci levels which are last supports for healthy & #Bullish market are all touching i mean the 0.218$(0.5 #Fibonacci) & 0.202(0.61 #Fibonacci) and i think these supports are strong enough to stop the correction and soon again it will pump and even can break daily high near 0.42$ and hit targets like 0.5$ and 0.75$. DISCLAIMER: ((trade based on your own...
market is still bullish and i am looking for breakout here to the upside for sure But we should consider this factor that major resistance now is touching and we may have first short-term fall. so for now we may have correction and dump to the targets like 3300$ which is first support of 0.23 Fibonacci level. and after this healthy correction or without it we can...
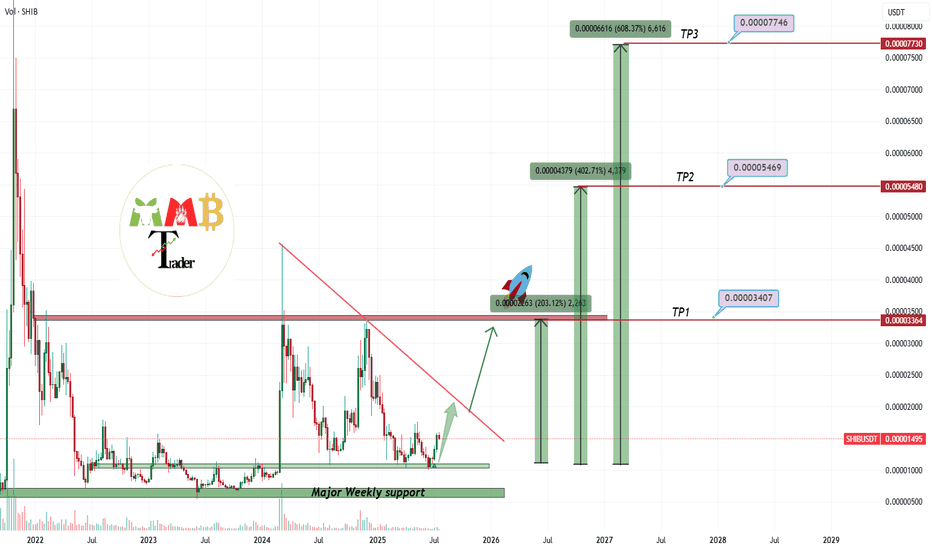
Two weekly supports which are 0.000010$ & 0.000007$ are strong enough to hold price like past years and i think soon those weekly +100% candles will surprise us here on BINANCE:SHIBUSDT too. all major supports and resistances are all also mentioned on the chart too. DISCLAIMER: ((trade based on your own decision)) <<press like👍 if you enjoy💚
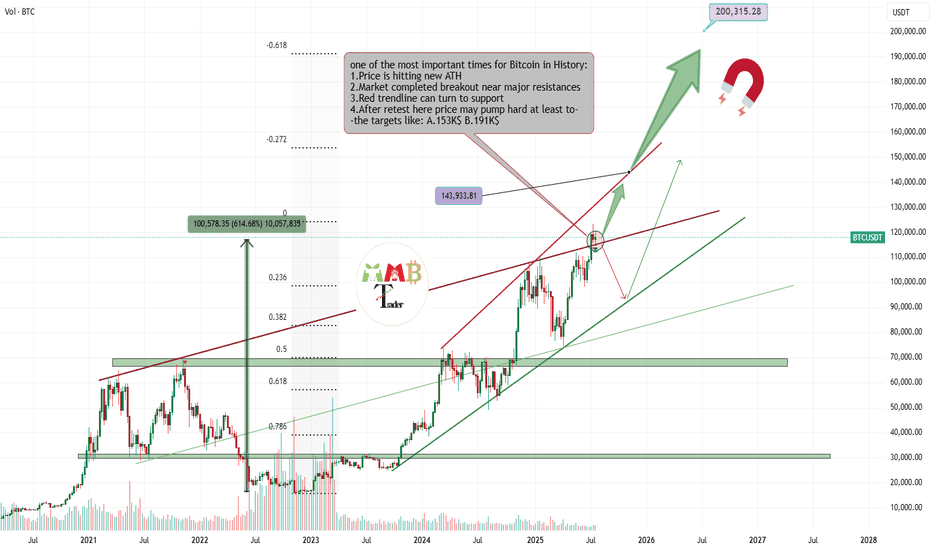
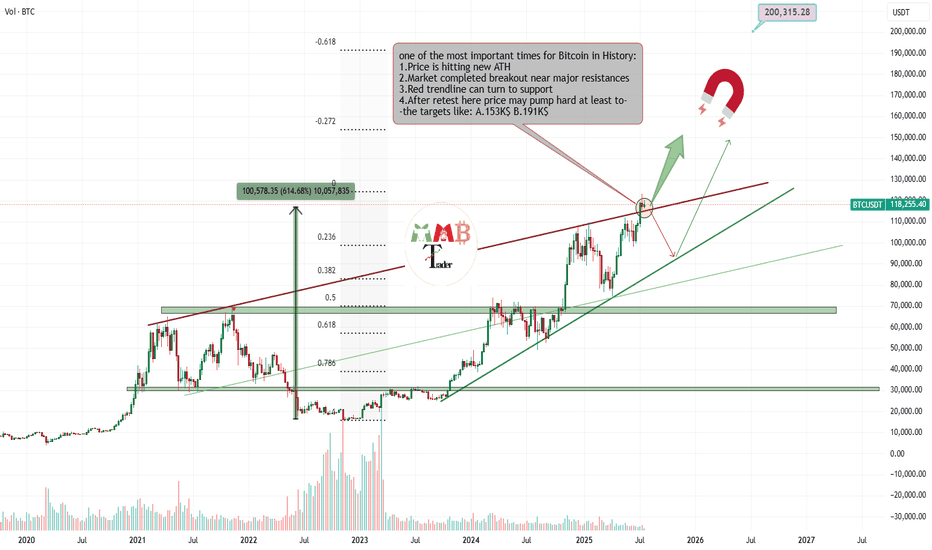
Major red resistance trendline is now broken also last week the retest is completed now price is range for a while for new week to start and fresh volume and buys that make path easier to reach above 140K$. Get ready and take a look at important zones at chart and possible scenarios which are all mentioned. DISCLAIMER: ((trade based on your own...
As we can see the breakout of red trendline also completed and volume increases after that and now market is testing major Fib levels like 0.5 & 0.61 soon we can expect more pump and gain here like the green arrows. so many stop loss also hit on this fast correction to the downside and price is ready to start next boom pump with kicking out leverage buyers...
As we mentioned before Price is now near weekly resistance and range and even short-term fall here is expected but this time i am looking for breakout to the upside and huge pump after that like the green arrows on chart. So get ready and wait for that breakout and next phase of bull run to start soon. DISCLAIMER: ((trade based on your own decision)) <<press...
Most traders around world now don't know what to do with their own trades or spot holdings, because some are in profit and how doubt of more pump and are still holding and some others miss this massive pump and think it can rest and fall now and it is not a good time to enter long. And many other questions and thoughts At this time is simply check the chart and...
While the spots are waking up it seems here we have kind of sleep and dead coin named BINANCE:SHIBUSDT but this turtle🐢 usually pump later than any one else in market and kill the emotions of some holders. So be patient + wait for breakout of red trendline = Heavy pump and profit coming. DISCLAIMER: ((trade based on your own decision)) <<press like👍 if you enjoy💚
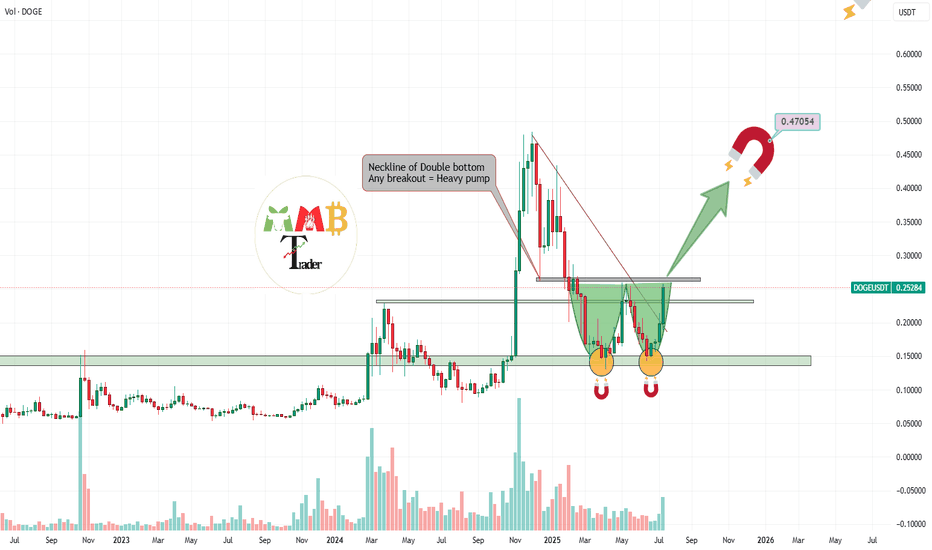
So many of Traders around the world sees weekly Strong reversal pattern which is double Bottom and they are waiting for breakout of neckline which is last major resistance of 0.26$ and i think soon it can break the resistance and heavy pump ahead after breakout is expected. But you may be wrong the upcoming pump here is due to my magnets on chart. find them all...
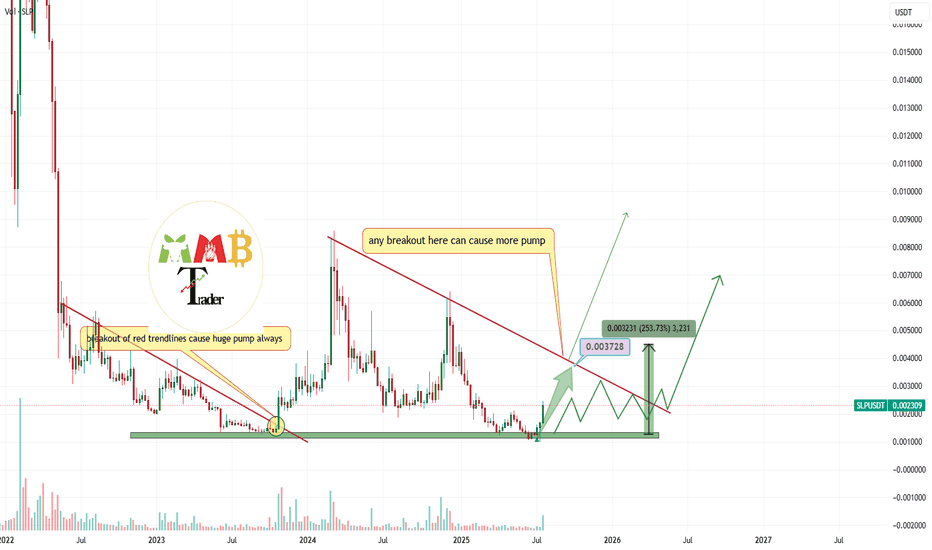
We mentioned before, near green support zone price is currently around major weekly supports and at least +150% pump to red trendline is ahead and after a valid breakout there even more rise and gain is ahead for BINANCE:SLPUSDT holders after a long sleep. DISCLAIMER: ((trade based on your own decision)) <<press like👍 if you enjoy💚
As we can see stop and next range zone for price can be near 135K$ to 137K$ and also major support zones now are 115K$ and 105K$ that can pump price once again if they touch. Red trendline was strong resistance and it usually stop the pump and it is daily high detector now unless it breaks this time. DISCLAIMER: ((trade based on your own decision)) <<press...
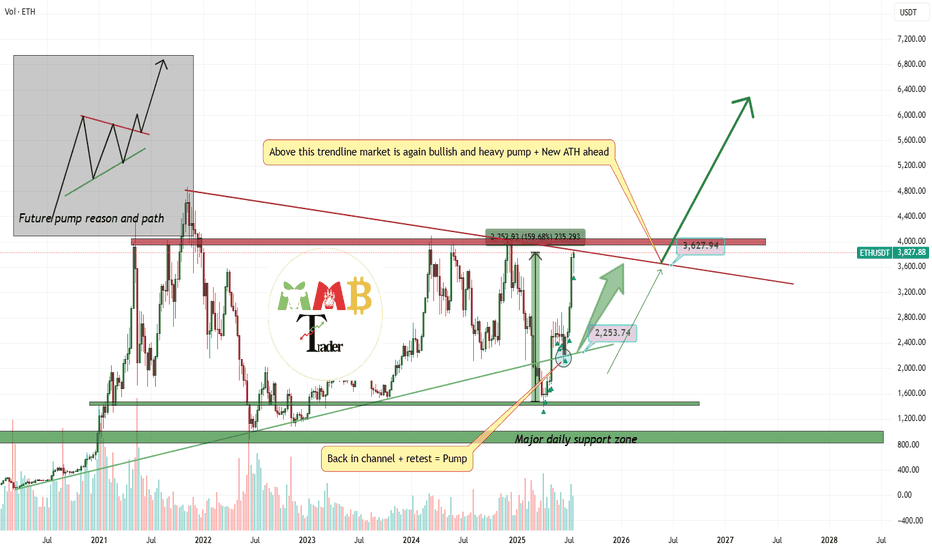
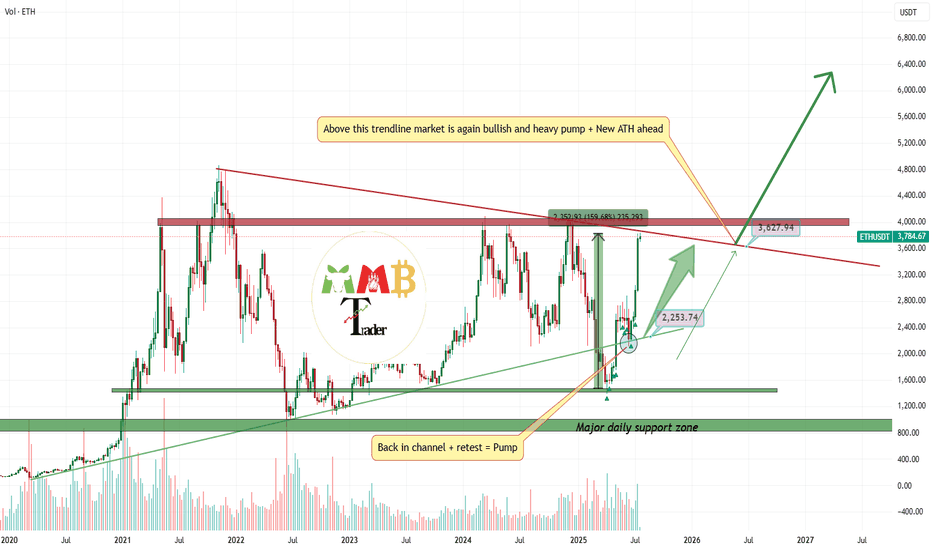
After i open long at weekly low and it almost play well until now: \https://www.tradingview.com/chart/ETHUSDT/BrdJLvgY-ETHUSDT-near-two-major-weekly-support-and-soon-2200/ Now i am looking for range here or without that range ASAP red trendline will break to the upside and more pump and gain also is expected and this is just the beginning. DISCLAIMER: ((trade...
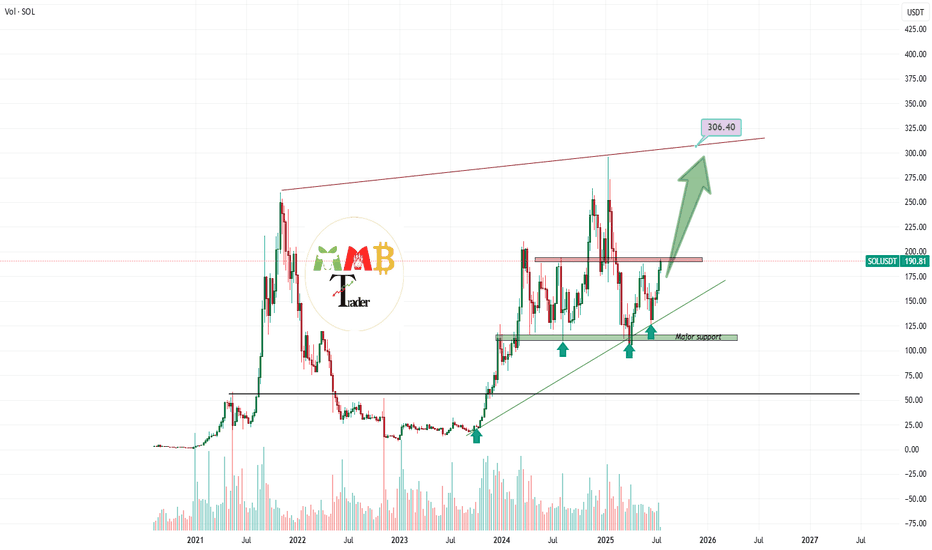
We are looking for more pump for BINANCE:SOLUSDT on this market and at least after breaking and hitting first targets which are 200$ and 250$ then it is time for new ATH above the 300$. Major supports and resistances are all mentioned on the chart too. DISCLAIMER: ((trade based on your own decision)) <<press like👍 if you enjoy💚
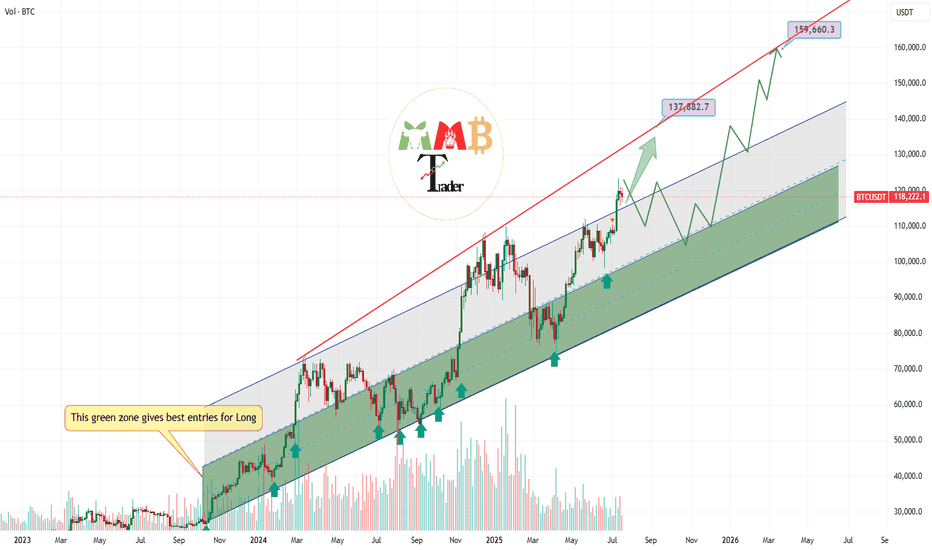
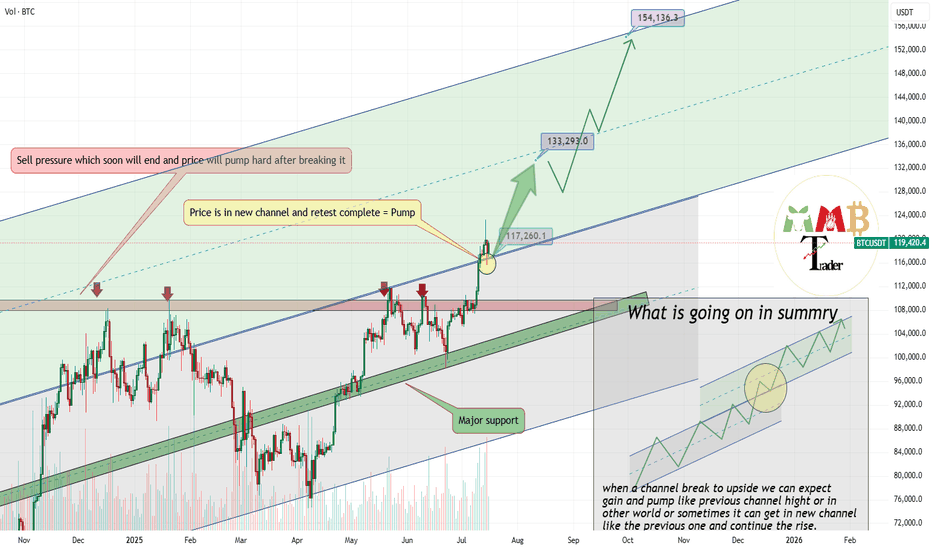
As we can see price broke previous channel and now is in new Ascending channel and pointing targets like 133K$ & 150K$. Major support now is around 116000$ to 117000$ and price hold strong and market can easily continue more pump here like the green arrow. BINANCE:BTCUSDT is now hitting ATH constantly and this just beginning of this bull run because ALT coins...
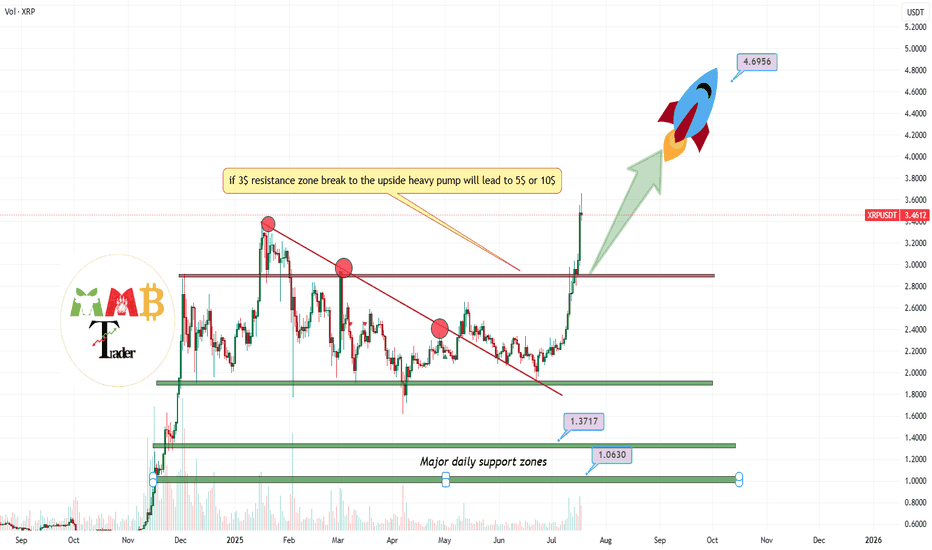
Our long from 2$ is now on +100% profit: \https://www.tradingview.com/chart/XRPUSDT/nI5aVpoY-XRPUSDT-after-breaking-red-trendline-can-easily-hit-3-5/ and red trendline broke and the pump started as it was expected but for now i think it can push a little more higher at least to the targes like 5$ and if this market remain bullish and BINANCE:BTCUSDT try to hit...
BINANCE:SHIBUSDT is not dead or sleep or it wont be any more and i think in this market soon it can see more gain and this +40% until now is just start and at least our first target which is +200% can hit soon like green arrow. DISCLAIMER: ((trade based on your own decision)) <<press like👍 if you enjoy💚


