got stopped out of my last buy order when BTC smashed through numerous resistances, but this is why you trade with stops. (losses kept minimal). but enj has now nearly fully retraced since its last leg up, im going to be scaling my buys in throughout this green box.
Ethereum looking to breakout of the ascending triangle, looking for this to break 300 heading towards 348 range, depending if BTC behaves.
i have been sitting out of the markets the past week with only few long term holds but, AMI resources seen incredible gains last year, but has since been falling after breaking its trend. the long term trend is still intact on the 1W and lines up perfectly with the 0.618 FIB.
as posted the other day i have been waiting for THR to break out of this year long falling wedge, with positive news of large quantities of gold found in their pilot mountain. good to see the volume coming in. going to let this one run.
Z1P looks like it is having a pause here at its support, i still feel we will continue down to the trend line at least before continuing up again. As you all know im very bullish on Z1P long term, this is not a bad thing to see this parabolic come back to reality a bit.
THR mining has been in a steady fall since its double top in December 2017, it has currently fallen down to a strong support from 2017, and broken out of the falling wedge.
ENJ looking to breakout of the falling wedge, it has fallen down nicely onto the previous resistance from its last run up, I'd be surprised if we don't see a break out here and a large leg up with the way alts are going ATM.
As said in my previous chart i have been riding Z1P since the $2.07 mark, watching to see if we bounced of the trend after breaking through the middle bollinger and the short term trend. as you can see to me Z1P has gone to bearish with RSI falling below 50, and a MACD cross on the Daily. we should see a bounce up to the trend line of the bottom bollinger before...
its been a pretty crazy run for Z1P of late, I'm hoping it can hold this line, otherwise will be looking at a break down to the $2.60 possibly the $2.50, also seems to have a ascending wedge forming on the daily. MACD also indicating bearishness. will be watching closely and monitoring my stops..
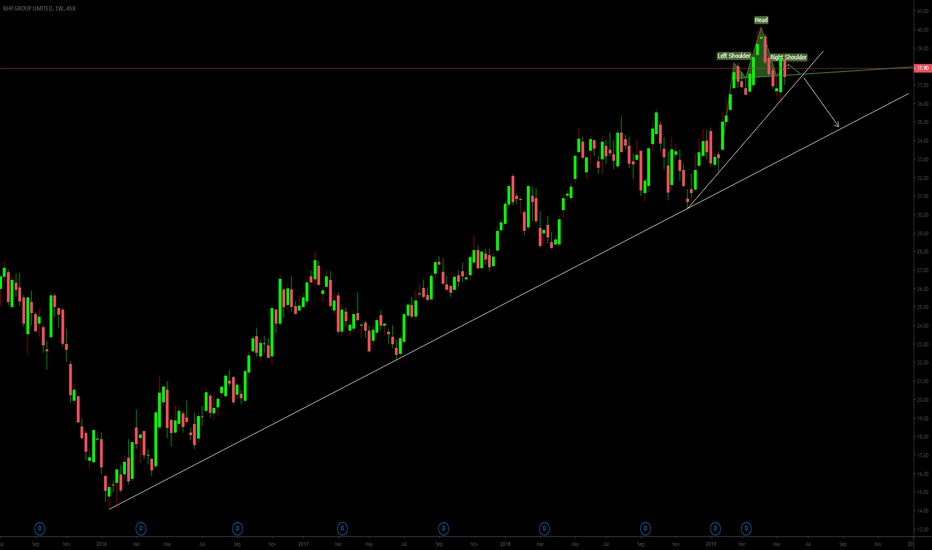
BHP looks to be forming a possible H & S at a strong resistance, looking at a move back to the longer trend of $34 or $35, before continuing its uptrend. ill also be looking at a close below the middle Bollinger band before entering this short.


