Magister_Arcanvm
Premium⊣ ⟁ BTC/USD - BINANCE - (CHART: 1W) - (Aug 05, 2025). ◇ Analysis Price: $114,907.55. ⊣ ⨀ I. Temporal Axis - Strategic Interval - (1W): ▦ EMA9 - ($112,389.19): ∴ Price action is currently positioned above the EMA9 on the 1W timeframe, reflecting ongoing bullish strength; ∴ The candle body maintains a healthy gap from the EMA9 line, indicating that...
⊣ ⟁ BTC/USD - BINANCE - (CHART: H1) - (Aug 02, 2025). ◇ Analysis Price: $113,869.77. ⊣ ⨀ I. Temporal Axis - Strategic Interval - (1H): ▦ EMA9 - ($113,889.32): ∴ The price is trading just below the EMA9, which acts as immediate reactive resistance; ∴ The short-term slope remains negative, with no breakout signal; ∴ Buyers are unable to push the price above...
⊣ ⟁ BTC/USD - BINANCE - (CHART: 1M) - (Aug 01, 2025). ◇ Analysis Price: $114,994.73. ⊣ ⨀ I. Temporal Axis - Strategic Interval - (1M): ▦ EMA9 - ($100,069.29): ∴ Price holds 14.93% above this dynamic threshold, indicating momentum continuation but also positioning within an overheated range; ∴ The EMA9 structure is firmly ascending, representing the spine...
⊣ ⟁ BTC/USD - BINANCE - (CHART: 1D) - (Jul 29, 2025). ◇ Analysis Price: $118,996.40. ⊣ ⨀ I. Temporal Axis - Strategic Interval - (1D): ▦ EMA9 - (Exponential Moving Average 9) - ($118,352.22): ∴ This short-term exponential blade reflects immediate price sensitivity, showing reactive balance across recent closes; ∴ Price currently floats above this...
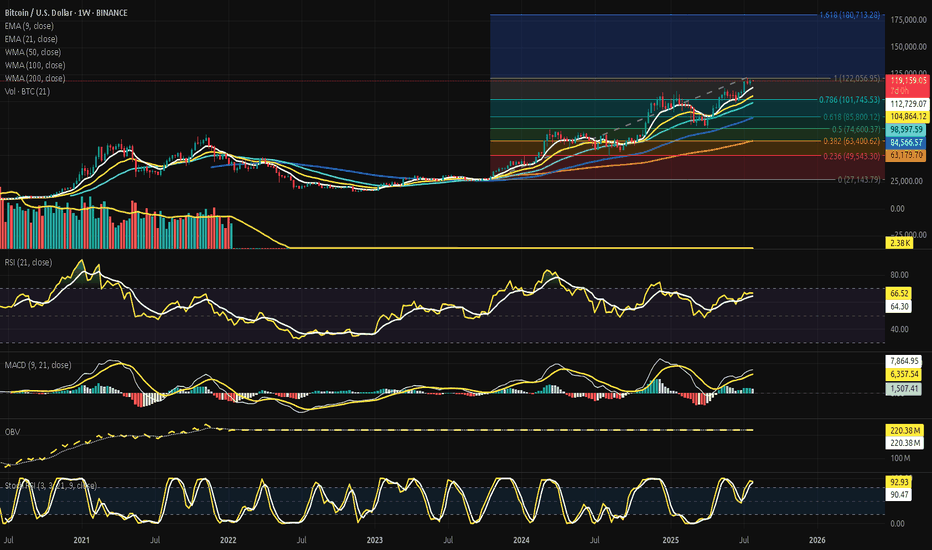
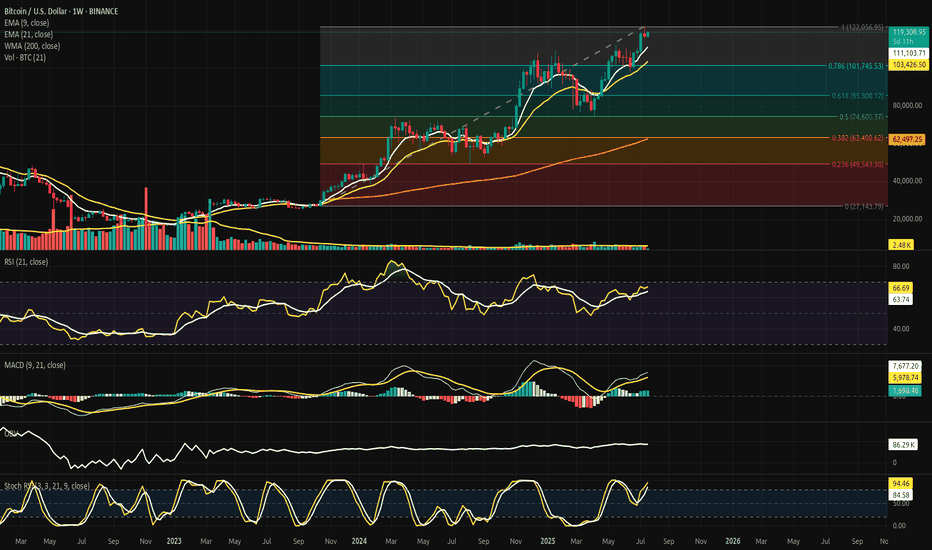
⊣ ⟁ BTC/USD - BINANCE - (CHART: 1W) - (Jul 27, 2025). ◇ Analysis Price: $119.374,00. ⊣ ⨀ I. Temporal Axis - Strategic Interval - (1W): ▦ EMA9 - ($112.771,21): ∴ The weekly close remains above the EMA9, preserving short-term bullish structure; ∴ The EMA9 continues rising at a consistent slope, reflecting sustained upward momentum; ∴ A retracement to this...
⊢ ⟁ BTC/USD - BINANCE - (CHART: 4H) - (July 27, 2025). ◇ Analysis Price: $118.309,59. ⊣ ⨀ I. Temporal Axis - Strategic Interval - (4H): ▦ TEMA9 - ($118.338,48): ∴ Price is currently below TEMA9, indicating near-term resistance; ∴ Curve is upward-sloping but flattening, suggesting fading acceleration; ∴ Acts as reactive signal line; minor rejection occurred...
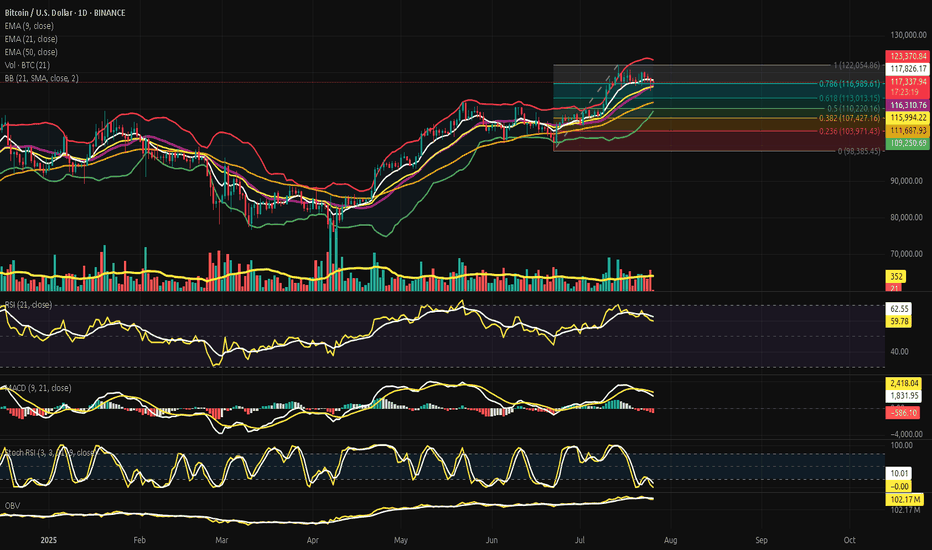
⊢ ⟁ BTC/USD - BINANCE - (CHART: 1D) - (July 26, 2025). ◇ Analysis Price: $117,421.02. ⊣ ⨀ I. Temporal Axis - Strategic Interval - (1D): ▦ EMA9 - ($117,842.79): ∴ The EMA9)is currently positioned at $117,842.79, slightly above the price ($117,421.02), acting as immediate dynamic resistance; ∴ Price has closed below EMA9 for multiple sessions, indicating a...
⊢ ⟁ BTC/USD - BINANCE - (CHART: 1H) - (July 24, 2025). ◇ Analysis Price: $117.830,17. ⊣ ⨀ I. Temporal Axis - Strategic Interval - (1H): ▦ EMA9 - ($118.267,48): ∴ The 9-period Exponential Moving Average (EMA9) was serving as immediate microstructural support until July 23rd, when a full-bodied bearish candle broke through it with volume below average but...
⊢ ⟁ BTC/USD - BINANCE - (CHART: 1W) - (July 22, 2025). ◇ Analysis Price: $119.209,03. ⊣ ⨀ I. Temporal Axis - Strategic Interval - (1W): ▦ EMA9 - ($111.083,72): ∴ Price remains well above the EMA9, with consistent bullish spacing; ∴ The weekly candle closes with strength and full-body integrity above it; ∴ EMA9 slope continues upward, supporting ongoing...
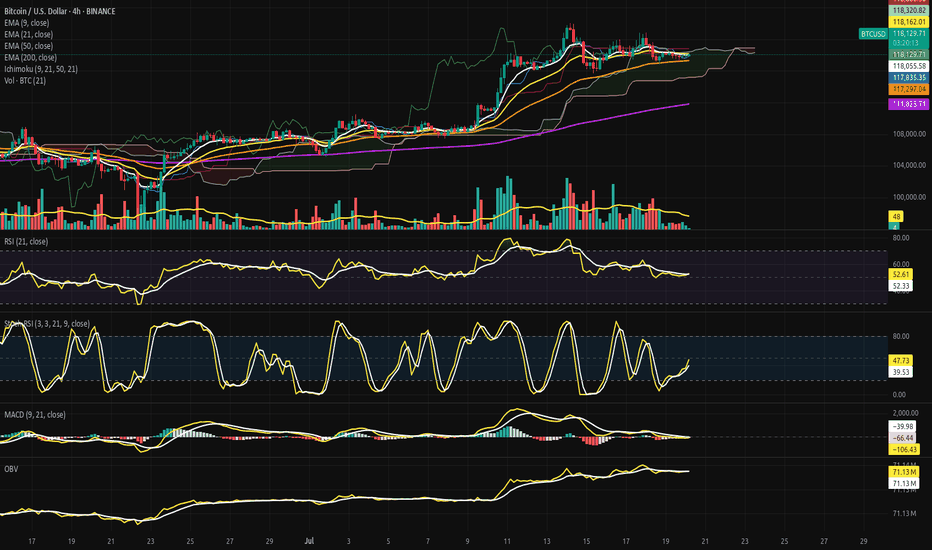
⊢ ⨀ BTC/USD - BINANCE - (CHART: 4H) - (July 20, 2025). ◇ Analysis Price: $117,919.29. ⊣ ⨀ I. Temporal Axis - Strategic Interval - (4H): ▦ EMA9 - (Exponential Moving Average - 9 Close): ∴ Price is currently hovering just below the EMA9 at $118,035.43, showing weakening immediate momentum; ∴ EMA9 is now flat-to-downsloping, indicating short-term loss of...
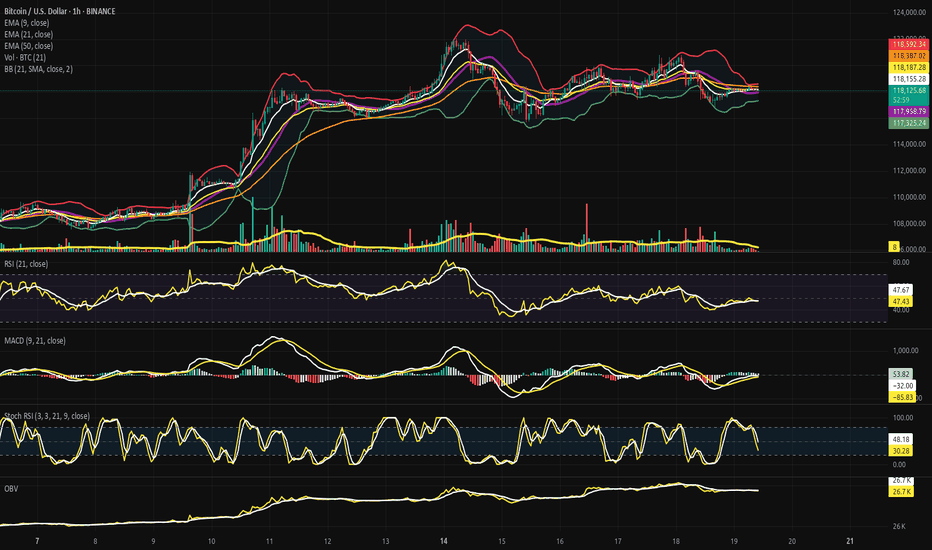
⊣ ⨀ BTC/USD – BINANCE – (CHART: H1) – (July 19, 2025). ◇ Analysis Price: $118,192.34. ⊣ ⨀ I. Temporal Axis - Strategic Interval - (H1): ▦ EMA9 - (Exponential Moving Average - 9 Close): ∴ Price: $118,192.34 | EMA9: $118,176.07; ∴ EMA9 is currently being pierced by price - neither clearly above nor decisively rejected; ∴ The EMA9 has flattened - signaling...
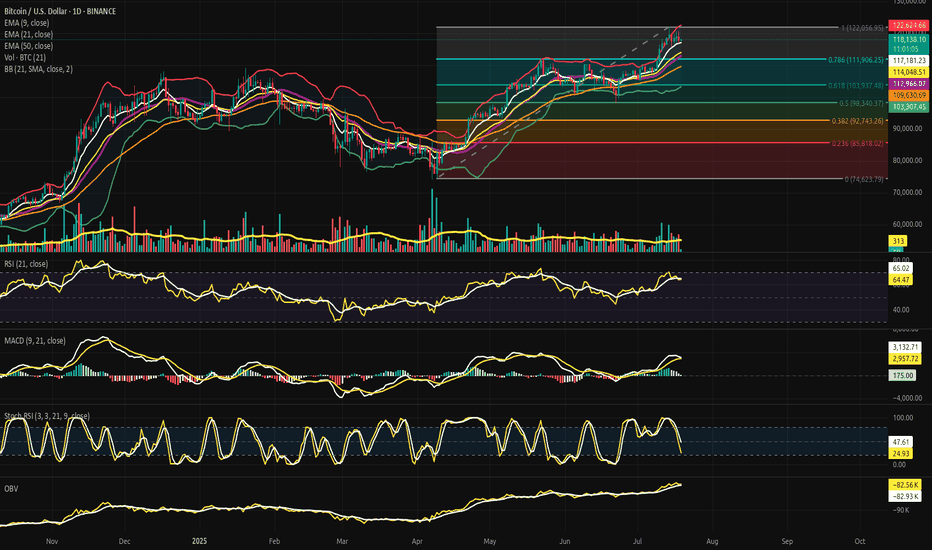
⊢ BTC/USD – BINANCE – (CHART: 1D) – (July 19, 2025). ◇ Analysis Price: $118,325.31 ⊣ ⨀ I. Temporal Axis - Strategic Interval - (1D): ▦ EMA9 - (Exponential Moving Average - 9 Close): ∴ Price is currently positioned above EMA9 at $117,218.67, confirming immediate bullish alignment; ∴ EMA9 is upward sloping and tightly hugging price candles, serving as the...
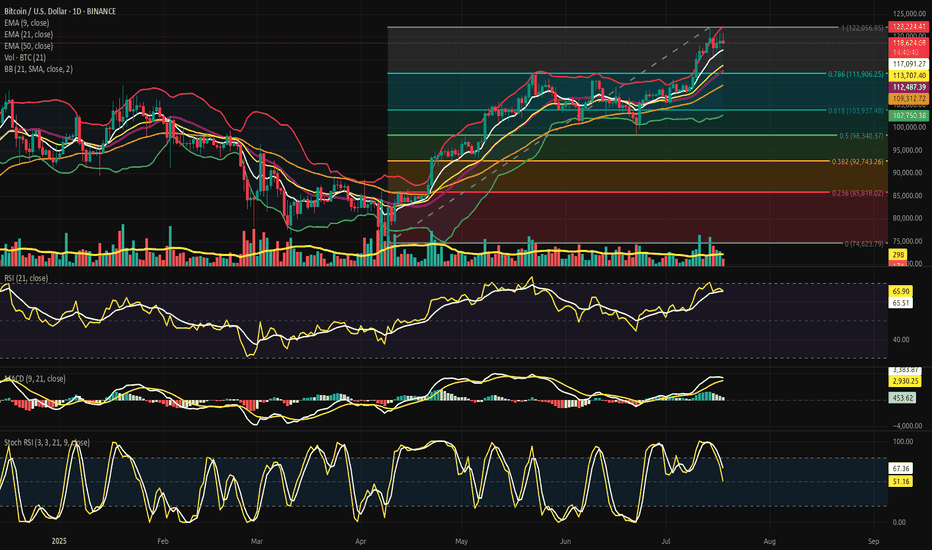
⊣ ⟁ BTC/USD - BINANCE - (CHART: 1D) - (Jul 18, 2025). ◇ Analysis Price: $118,866.60. ⊣ ⨀ I. Temporal Axis - Strategic Interval - (1D): ▦ EMA9 - (Exponential Moving Average - 9 Close): ∴ EMA9 is currently positioned at $119,077.81, closely tracking the current price, acting as dynamic micro-support; ∴ The slope of EMA9 remains upward, with price...
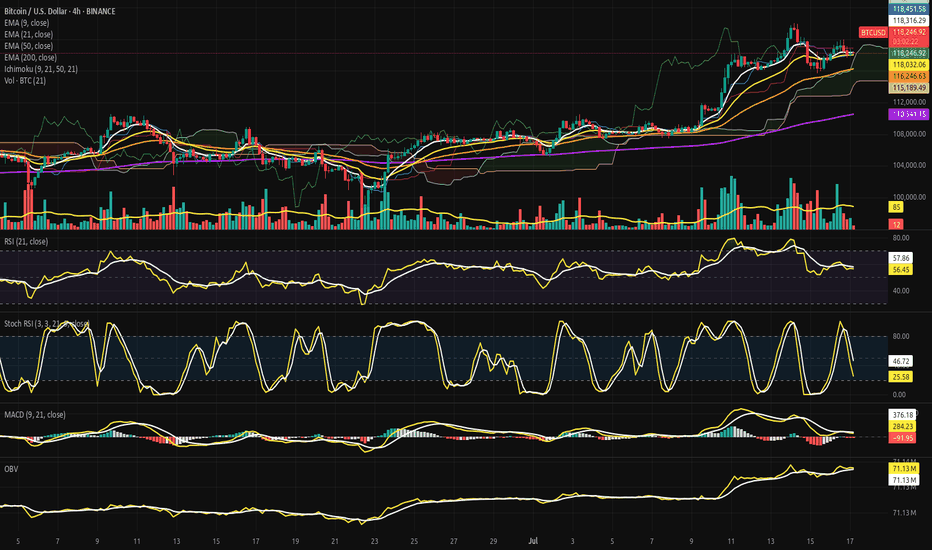
⊣ ⟁ BTC/USD - BINANCE - (CHART: 4H) - (July 17, 2025). ◇ Analysis Price: $118,099.62. ⊣ ⨀ I. Temporal Axis - Strategic Interval – (4H): ▦ EMA9 - (Exponential Moving Average - 9 Close): ∴ EMA9 is currently positioned at $118,286.83, marginally above the current price of $118,099.62; ∴ The slope of the EMA9 has begun to turn sideways-to-downward, indicating...
⊣ ⟁ BTC/USD - BINANCE - (CHART: 1D) - (Jul 14, 2025). ◇ Analysis Price: $121,662.29. ⊣ ⨀ I. Temporal Axis - Strategic Interval - (1D): ▦ EMA9 - ($115,313.08): ∴ The EMA9 is aggressively sloped upward, serving as dynamic support during the latest expansion phase. ✴️ Conclusion: Bullish control confirmed; momentum is guided tightly by the EMA9 anchor. ⊣ ▦...
⊣ ⟁ BTC/USD - BINANCE - (CHART: 1D) - (Jul 09, 2025). ◇ Analysis Price: $110,767.80. ⊣ ⨀ I. Temporal Axis - Strategic Interval - (1D): ▦ EMA9 - ($108,767.55): ∴ Price remains above the 9-day EMA, maintaining a short-term bullish posture; ∴ The moving average acts as dynamic support with positive slope. ✴️ Conclusion: Immediate trend remains intact, with...
⊣ ⟁ BTC/USD – BINANCE - (CHART: 1H) – (Jul 03, 2025). ◇ Analysis Price: $109,716.55. ⊣ ⨀ I. Temporal Axis – Strategic Interval – (1H): ▦ EMA 9 – ($109,510.76): ∴ Price remains above EMA9, sustaining the short-term bullish impulse; ∴ The EMA 9 is ascending with consistent candle-body support across recent sessions. ✴ Conclusion: Tactical momentum persists...
⊢ ⟁ BTC/USD – BINANCE – (CHART: 1W) – (Date: July 01, 2025). ◇ Analysis Price: $106,464.00. ⊢ ⨀ I. Temporal Axis – Strategic Interval – (1W): ▦ EMA21 – ($98,213.17): ∴ The EMA21 has provided dynamic mid-term support since early Q4 2024; ∴ Recent pullbacks respected the line precisely, confirming its role as tactical trend anchor. ✴ Conclusion: Tactical...


