ManishDamani663ab2f2a8cf4dde
after breaching 65.238 wti get more weaker as its wave 3 or c open and may take it to 57-58 $ but one bearish crab again also appear may develop. Levels in chart, sell on rally market but near that level with sl and buy signal one can see reversal. I am not Sebi registered analyst. This is not buy , sell hold recommendation.
Formed Gartley though break 0.786 ratio but allowed upto starting point , also forming ABCD pattern, appear ib wave B or X later will decide b or X which wave . Let see. I am not SEBI registered analyst, this is not buy , sell , hold recommendation. Only personal view for educational purpose. Thanz. if goes wrong no offence.
inverted head and shoulder observed if breakout given target too in chart. Not a sebi registered analyst . No buy, sell and hold recommendation personal view.
Bearish butterfly appear completed, and near completion ratio once reversed, Wave wise also reversal possible wave B in lower degree appear to be completed.
Bearish bat pattern formed though first target achieved not able to post on time when detected but still there is room and also wave B may be folding and moving for wave C new low possible but time wise still one up may come but that possibly be selling opportunity.
Bullish Crab pattern may form, but over all sell on rally as ichimoku cloud break in weekly but fallen too much so need to be careful. Level of crab pattern completion spotted in chart.
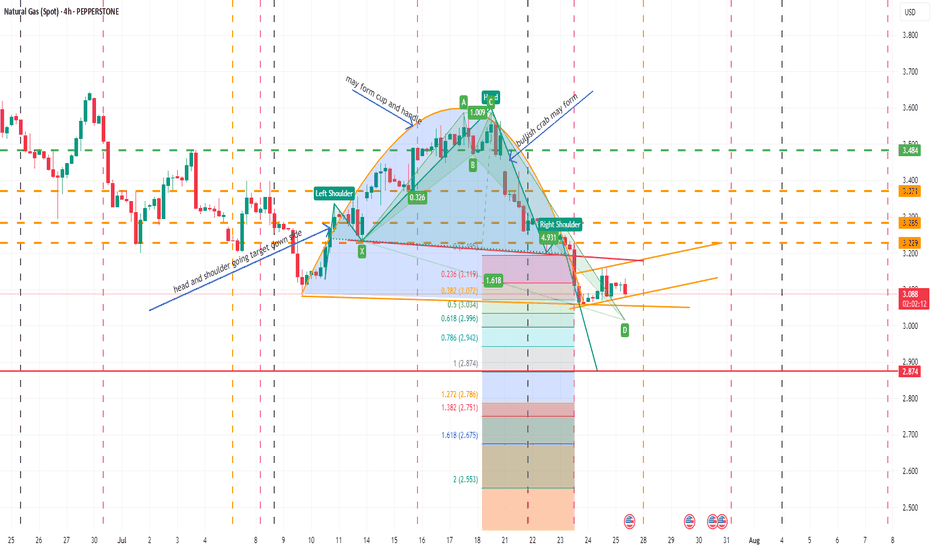
May form inverse cup and handle, bullish crab also about to form , after completing one head and shoulder pattern already posted earlier new head and shoulder going on. In daily and 4 hr chart below ichimoku cloud. In weekly within cloud. Moving averages showing weakness in daily and weekly, monthly candle also no bearish. May be in such scenario bullish crab...
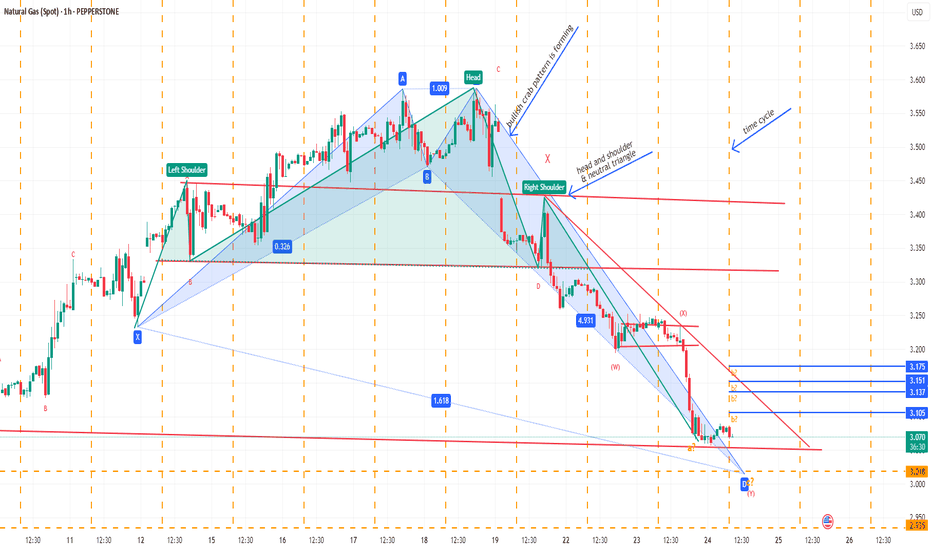
Bullish crab pattern may form, if another harmonic pattern may develop later. Neo wave wise may be in wave Z need confirmation. Time cycle high low break may be trend continue in break out/down direction. Not sebi research analyst.
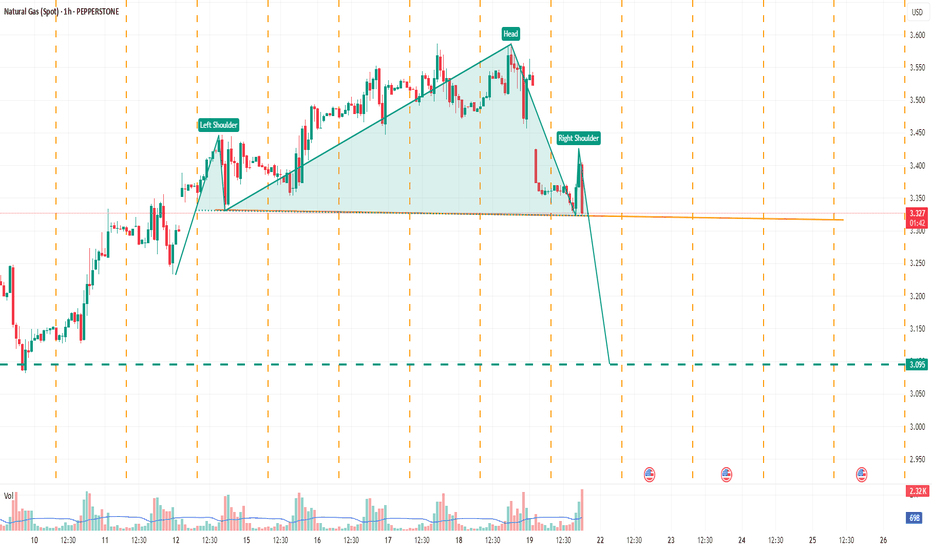
Head and shoulder pattern observed and neo wave wise also appear either neutral triangle , if break neck line good fall and then near another bigger head and shoulder neckline. Let see
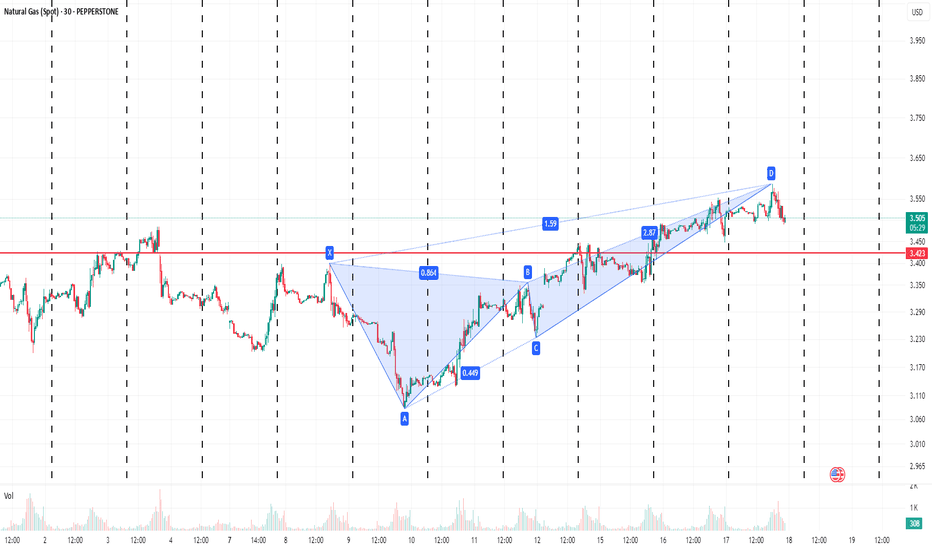
Made Bearish butterfly and Bearish dragon too but only presenting butterfly and also appear end of wave X as 81% retracement form one previous top also completed. let see
Well trying to read this complex correction again and assuming this is larger x wave or f wave if diametric in intermediate degree and time confirmation yet to come if next high previous fall not passed with in that time, then new low again possible, Let see. Not a sebi registered analyst, just personal view
Bearish crab pattern may form may fall from here too due to wave structure and trend line resistance diametric pattern F wave also appear to forming. View may change as per market structure. Not SEBI registered RA or IA , personal view.
time wise from 2 to 3rd wave top appear wave 4 yet not complete in irregular correction, Alternatively we may be in wave 5 first wave let see Monday clear more picture , though some people started giving target of 59000+, if so this is wave 1 and still one correction due as bearish divergence also emergins in hourly charts. Thanz just a learner may be wrong and...
Appear to me in g wave of diametric. But inverted h & s target is due. So let see which pattern now works from Monday.


