MarkFraser
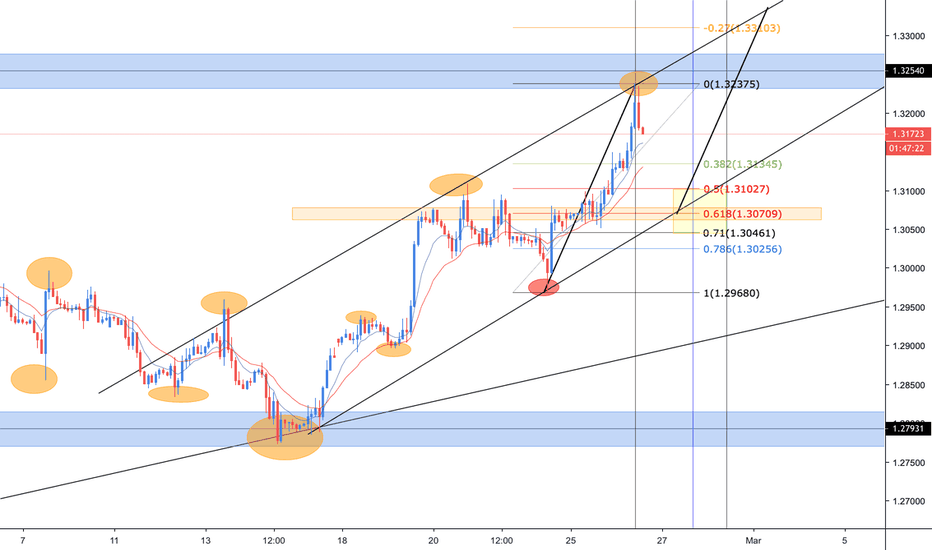
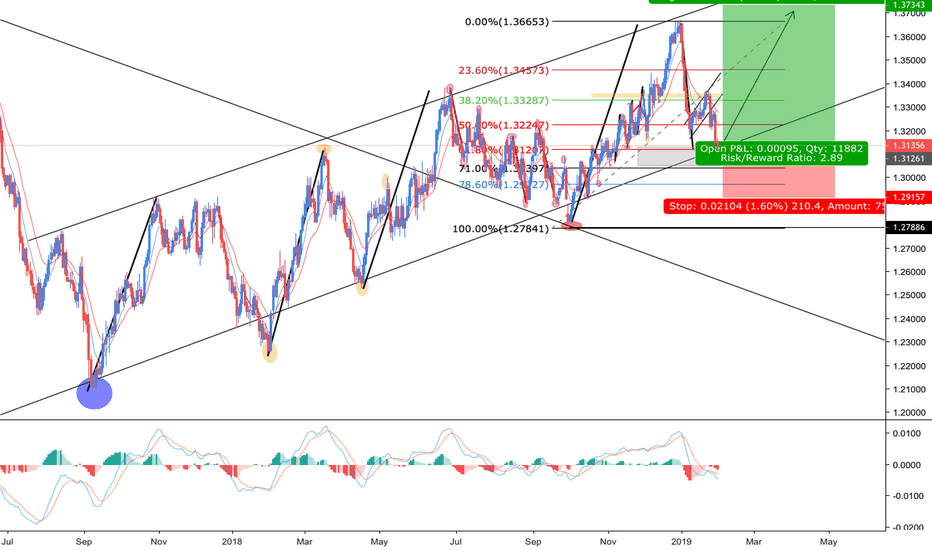
EssentialMeasured moves all up in this trend. Expecting reversal around 50-61.8 FIB LEVEL.
RSI divergence will help push the pair down towards the trend line which matches with the 61.8
61.8 retracement matches up with trend line nicely which is a nice confluence level.
Forgot to post this. But you can see a reversal happening on the 61.8. Measured move lining up with the -27 nicely
A lot of confluence at the 61.8. RSI is near overbought section suggesting possible reversal soon.
You can see that this pair has a change in trend, we have that first pullback at around the 0.5/61.8 region and matches with the trend based fib time zone. We then expect the next measure move to be about the same as previous price which matches with my TP of -0.27. You can also see some RSI divergence and H&S pattern giving us more indication of selling positions.
EUR/NZD has been creating measured moves through out the downtrend. If we measured out the measured moves they are all equal so have a good idea that the 61.8 fib retracement level will be met before massive swings low. This meets perfectly with my TP zone of the -27.
A Elliot wave pattern has occurred and plenty of measured moved has repeated the same pattern. Therefore we have the same idea happening alongside a 61.6 retracement giving us the best possible entry.
Around 120 pip gain for 35 pip SL. A change in trend has happened as well as a break through a trend line so wait for the re test at the 61.8 region.
This pair loves to move in 100s of pips, we will look to take the retracement around the 61.8 fib level, We are looking to catch around 500 pips minimum off this move. There is RSI divergence as well as measured moves suggesting this move to happen. If you see here, the measured move is at the end of its tether which means a retracement is soon to happen. This...
So NZD/USD has created a new down trending market as it broke past that recent HL point. There is gonna be a pull back around the 61.8 fib region before creating new swing lows. You can see its tested this key area of resistance and shot uo. This then suggests your able to get in before the wave even starts thus meaning catching all those pips...
So this currency pair is moving on the downside towards my weekly trend line. Once it moves to this point, there should be a 61.8 retracement as well as the weekly which means big moves to come soon. This is more of a longer trade set up.
So this currency has been repeating the same surge buys for quite a while now, as you can see I measured the buys with the trend tool and I will be expecting g to climb to either the 61.8 and sell or where I have stated.
So Ripple has reached areas of big resistance. I back tested and saw that during this zone where it is at currently, there was always a massive drop/rise. So I will be expecting it to rise high on this occasion. Note: THIS IS AN IDEA NOT A SIGNAL FOR YOU TO TRADE
As you can see, the bitcoin has did an Elliot wave pattern on the upside, now it must repeat it on the downside, so far it has created a nice shape perfect for this kind of trading. I will expect it to move towards the 50.0 mark then shoot upwards
So Ripple has a lot of potential at the moment, has created 3 very strong candles and all indicators suggests that it could pull upwards even further. Has created 2 very nice pull backs and will push higher then rally back. Trade with CAUTION...


