MavRich_Trading
EssentialBitcoin is trying to break out of the 110,000 If we break out we will see a new high If we don’t break it we could see 105k possibly 100k
Title: XRP/USD (RIPPLE) BUY Asset: Crypto Symbol: XRP/USD Market Entry Price 1: $2.28 Limit Entry Price 2: $2.08 Stop Loss: $1.88 Take Profit 1: $2.48 (close 10%) Take Profit 2: $2.78 (close 25%) Take Profit 3: $3.38 (close 50%) Take profit 4: $3.88 (close 75%) Take profit 5: $4.38 (close 100%) Status: ACTIVE
Entry 1 $500.00 Entry 2 $460.00 Stop loss $440.00 Take profit 1- $550.00 (Close 25%) Take profit 2- $600.00 (Close 50%) Take profit 3-$650.00 (Close 75%) Take profit 4-$700.00 (Close 100%)
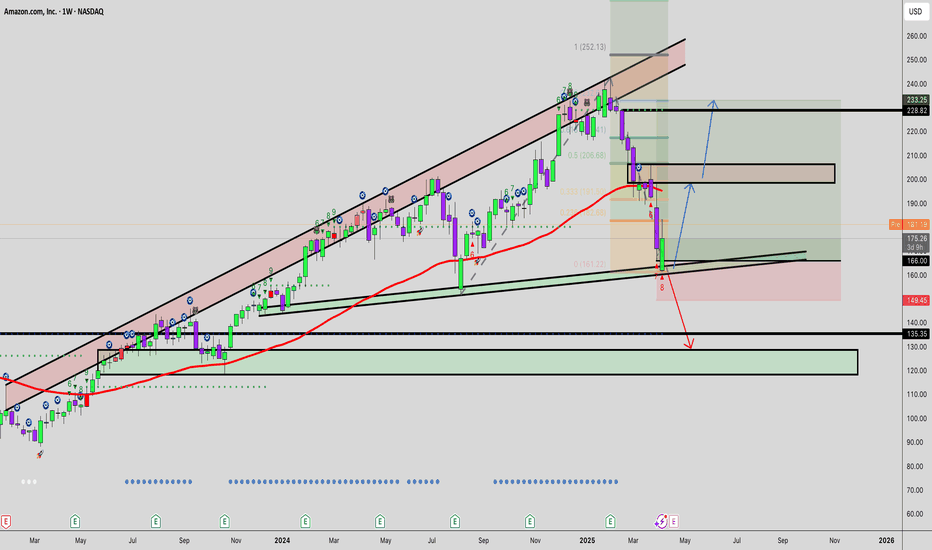
If $160.00 holds we can see $200 if we break below$160.00 we could see $140-$120 LONG TRADE Entry 1 $175.00 Entry 2 $165.00 Stop loss $155.00 Take profit 1- $195.00 (Close 33%) Take profit 2- $215.00 (Close 66%) Take profit 3-$230.00
XRP/USD long Entry Price 1: $2.10 Entry Price 2: $1.70 Stop Loss: $1.20 Take Profit 1: $2.50 Take Profit 2: $2.80 Take Profit 3: $3.20 Take Profit 4: $3.50
DOT LONG Entry Price 1: $4.60 Entry Price 2: $4.40 Stop Loss: $4.10 Take Profit 1: $4.80 Take Profit 2: $5.00 Take Profit 3: $5.20 Take Profit 4: $5.50 Status: ACTIVE LTC NEUTRAL WAITING FFOR BREAK OUT
Entry Price 1: $84,000 Entry Price 2: $83,500 Stop Loss: $82,000 Take Profit 1: $86,000 (Close 25%) Take Profit 2: $88,000 (Close 50%) Take Profit 3: $90,000 (Close 75%) Take Profit 4: $92,000 (Close 100%) Status: ACTIVE
Entry 1 $55.50 Entry 2 $45.50 Stop loss $35.50 Take profit 1- $65.50 (Close 25%) Take profit 2- $75.50 (Close 50%) Take profit 3-$90.50 (Close 75%) Take profit 4-$110.50 (Close 100%)
Entry 1 $450.00 Entry 2 $440.00 Stop loss $430.00 Take profit 1- $460 (Close 33%) Take profit 2- $480.00 (Close 66%) Take profit 3-$500.00 (Close 100%)
Entry Price 1: $78,000 Entry Price 2: $73,000 Stop Loss: $63,000 Take Profit 1: $85,000 (Close 25%) Take Profit 2: $98,000 (Close 50%) Take Profit 3: $108,000 (Close 75%) Take Profit 4: $118,000 (Close 100%) Status: ACTIVE
Entry 1 $120.00 Entry 2 $110.00 Stop loss $95.00 Take profit 1- $145.00 (Close 33%) Take profit 2- $170.00 (Close 66%) Take profit 3-$195.00 (Close 100%)
Entry 1 $220.00 Entry 2 $200.00 Stop loss $180.00 Take profit 1- $250.00 (Close 33%) Take profit 2- $290.00 (Close 66%) Take profit 3-$330 (Close 100%)
Entry 1 $60.50 Entry 2 $45.50 Stop loss $30.50 Take profit 1- $80.50 (Close 25%) Take profit 2- $100.50 (Close 50%) Take profit 3-$120.00 (Close 75%) Take profit 4-$140.00 (Close 100%)
XRP/USD long Entry Price 1: $2.20 Entry Price 2: $1.70 Stop Loss: $1.20 Take Profit 1: $2.50 Take Profit 2: $2.80 Take Profit 3: $3.20 Take Profit 4: $3.50
Entry 1 $255.00 Entry 2 $225.00 Stop loss $200.00 Take profit 1- $275.00 (Close 33%) Take profit 2- $300.00 (Close 66%) Take profit 3-$325 (Close 100%)
Time Frame: 1D Entry Price 1: $4.40 Entry Price 2: $3.40 Stop Loss: $2.40 Take Profit 1: $5.40 Take Profit 2: $7.50 Take Profit 3: $9.50 Take Profit 4: $11.50 Status: ACTIVE
Entry Price 1: $78,500 Entry Price 2: $73,500 Stop Loss: $68,500 Take Profit 1: $85,000 Take Profit 2: $95,000 Take Profit 3: $105,000 Take Profit 4: $115,000 Status: ACTIVE
im going long, but this is what can happen United Parcel Service, Inc. is an American multinational shipping & receiving and supply chain management company founded in 1907 and headquartered in Sandy Springs, Georgia


