McGuireTO
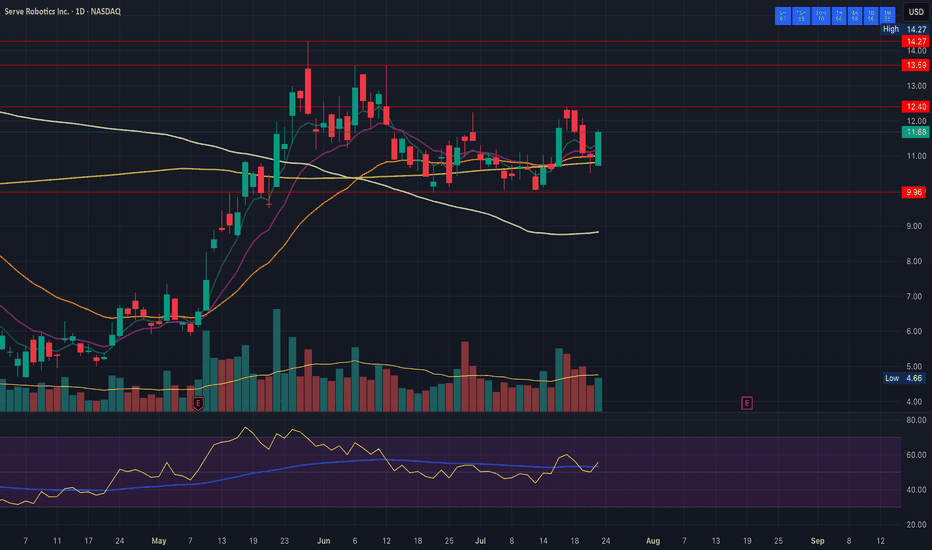
PremiumI really like how the daily, weekly, and monthly charts on SERV are lining up as the daily coils and tightens sideways within a constricting channel. I'm looking for a violent move on the break. Support: 9.96 Resistance 12.40
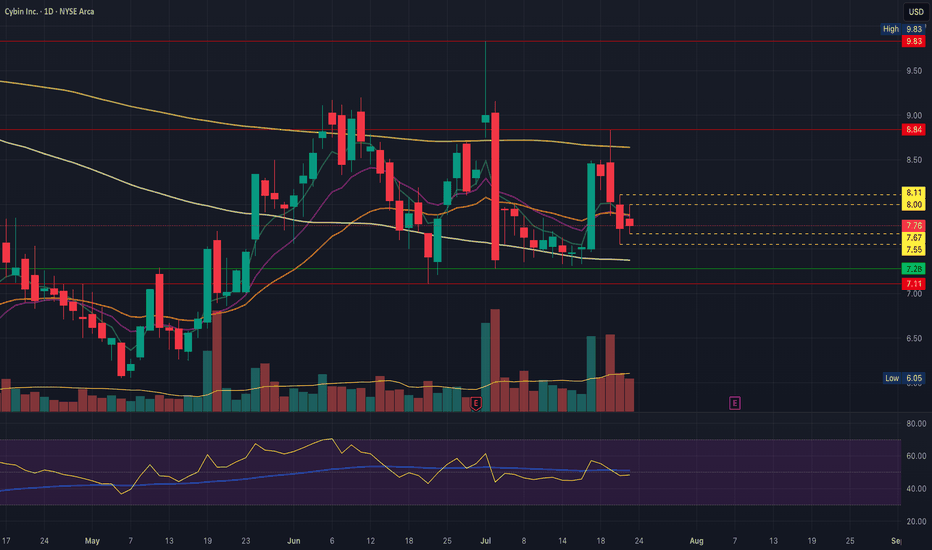
CYBN remains within a wide daily equilibrium, we have an inside bar today for early clues to get an early gauge on direction. Nothing changes for me as long as price remains between 7.11 and 8.84, and we can remain tightening within this range for another couple of weeks.. Support: 7.67, 7.55, 7.28, 7.11 key Resistance: 8.00, 8.11, 8.847 key
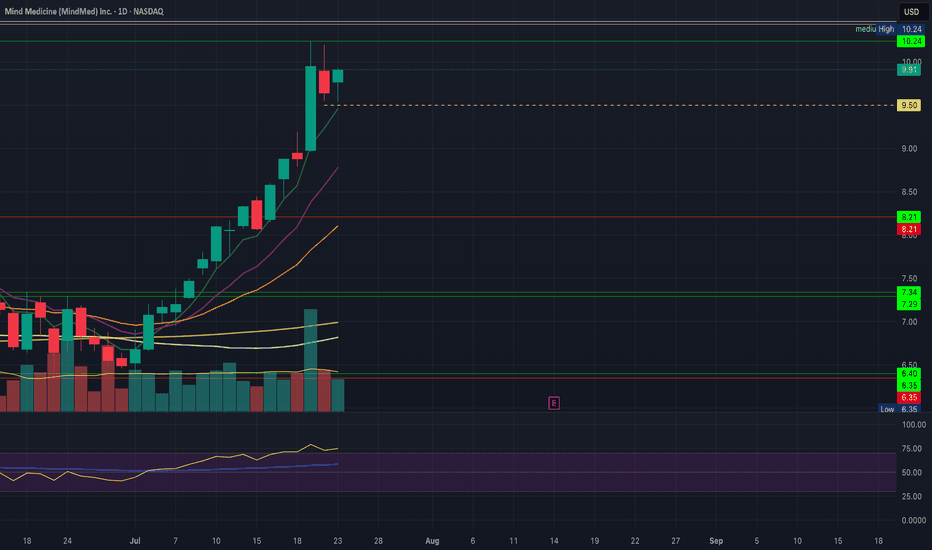
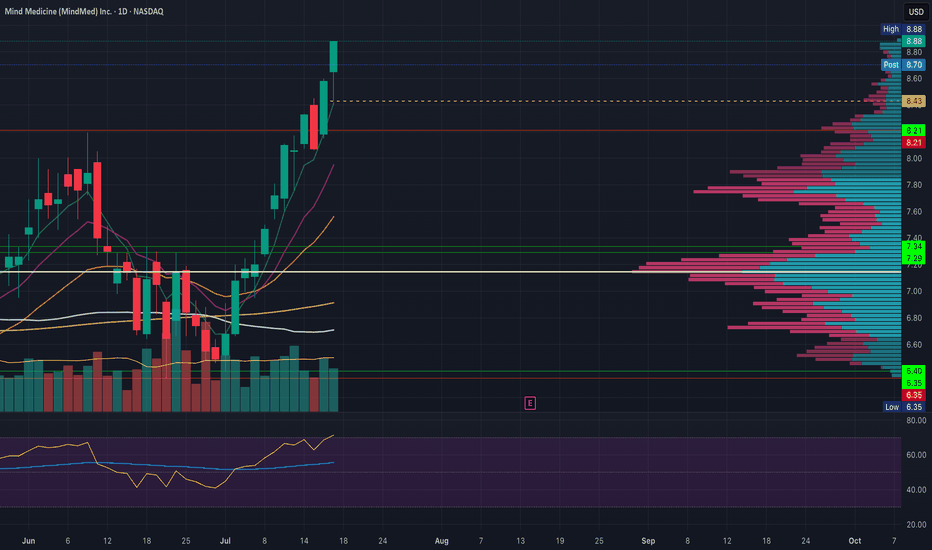
MNMD bulls are setting up a daily bullflag just below key monthly resistance at 10.44, the break of which would confirm the monthly trend change for the first time in the history of the chart. 10.24 key short term resistance to confirm the bull flag. Support: 9.50, 9.00, 8.79, 8.51, 8.43 Resistance: 10.24, 10.44, 10.47, 11.00, 11.22
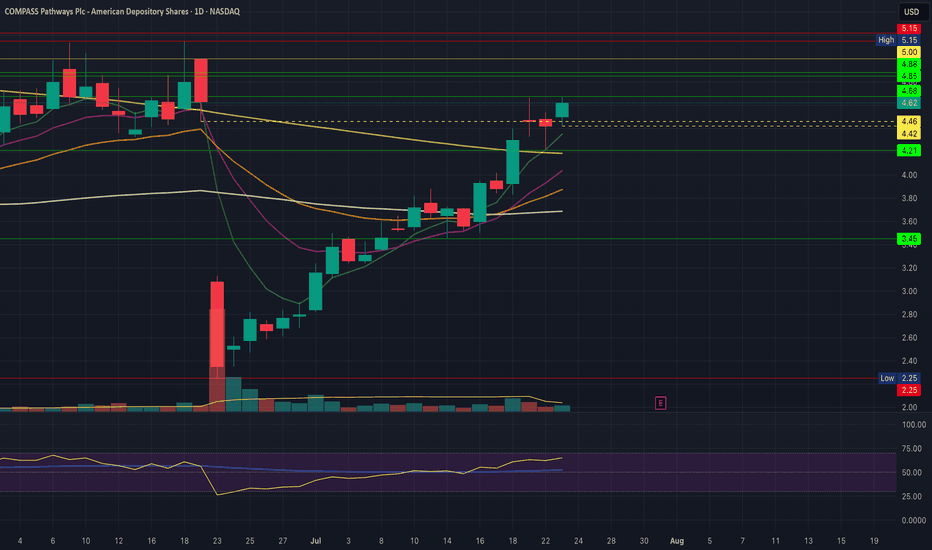
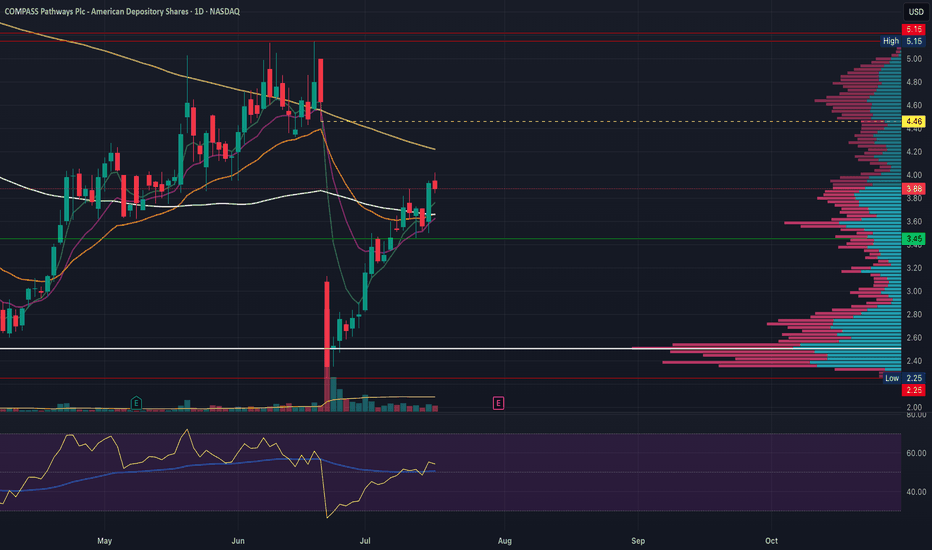
CMPS bulls attempting to confirm the daily bullflag and keep the very impressive bounce going, If we reject tomorrow anticipate a 4hr equilibrium and we'll look for a higher low above 4.21 and a tightening range for the next few days. Support: 4.42, 4.21 Resistance: 4.68, 4.85, 4.88, 5.00
ATAI bulls bought the dip for the third day in a row off of 3.31 support and V-shaped to a new high of day. As mentioned in previous videos we are now in a medium volume node so price can move through this area a bit more easily. Beware of short term extension, I wouldn't be a buyer up here but I see no reason to be a seller. Support: 3.77, 3.75, 3.68, 3.31...
Great looking chart, very nice setup indicating sector bullish continuation is likely. 4hr uptrend remains our guide with the last 4hr HL off of EMA12. Support: 16.19 Resistance: 17.00. 17.60, 18.20
CMPS had a very modest 1% pullback today after a huge 10% bull move yesterday to confirm the daily uptrend. Bulls are very happy to have seen most of those gains kept and not taken as profit. Resistance: Daily 200 SMA, 5.15, 5.22 -> numerous weekly tops in the 5.20s Supports: 3.50, 3.45, 3.24, 2.25
CYBN finally breaks out of 2-weeks of basing support on a very high volume bull move, close at the high of the day. I would normally anticipate a lower high below 9.83 but if this massive volume (4.5x yesterday volume!) keeps up, bulls may be able to take that level out. We will learn more in the coming days! Resistance: Daily 200 SMA, 9.16, 9.83 Supports:...
Bulls close at high of day, continuing a very strong two week bull move to confirm the weekly uptrend and continue to march towards key Monthly resistance at 10.44. We won't be surprised for daily consolidation when it comes but for now the hourly uptrend is our guide and the daily chart is riding a very fast moving EMA5. Resistances Weekly 200ma,...
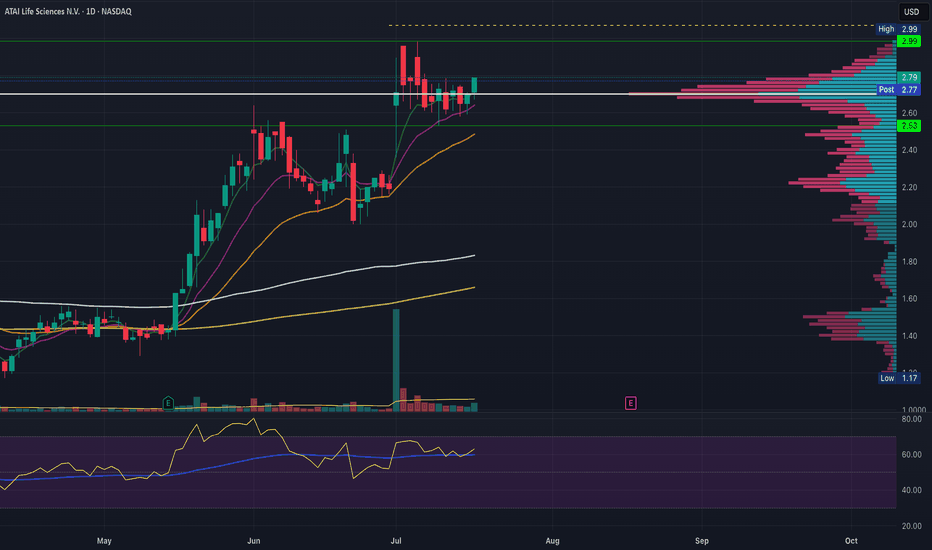
ATAI gave us the highest close we've seen in nearly 3 years today as bulls closed at high of the day approaching resistances from the gap up on July 1st. Today saw 2x the volume traded yesterday which is a great sign when looking for daily continuation. Anticipate resistance at 2.81. 3.00, 3.01, and weekly 200 SMA Red flag from here would be to fail at 3.00 and...
CYBN continues to reject form 4hr EMA12, bulls need to break above this in the next few trading sessions or it will continue to decline and knock the price below support, which would be a big step backwards and would be a clear signal that CYBN is not enjoying the same series of bullish signals that ATAI and MNMD are giving
MNMD with a very bullish close knocking on the door of double-top weekly resistance at 8.21. Hourly RSI cooled off after hours and bulls want to break this level first thing tomorrow and see clear followthrough for continuation.
The 4hr uptrend is our guide on CMPS as it sets a series of higher lows riding EMAs as support. Eventually we will lose the 4hr uptrend, signalling that daily consolidation is underway. Having bounced 70% from the fear dump low, we are anticipating a daily higher low above 2.25 and the size of that pullback will let us know the likelihood of continuation vs a...
ATAI closed the day with a bullish looking candle for the first time since daily consolidation started July 2. Big bounce on the hourly chart today but stopped just shy of two key short term hourly resistances 2.76 and 2.82. Tomorrow bulls want to see these levels taken out and an hourly uptrend regained in order to call 2.53 our new daly higher low. A big...
Nothing changes for me between 7.11 and 8.01. Break below and I will stop out of my swing and be very patient while I reassess, break above 8.01 and we look for a lower high below 9.83. Currently, 4hr EMA12 continues to be resistance on each little bounce attempt. If you are bullish here, you have decent entry opportunity to play off of 7.11 support with a stop...
CMPS continues it's slow grind uptrend riding the 4hr 12EMA which hasn't been lost since reclaiming it a few days after the news dump. The daily chart is a stair-step (a higher low each consecutive candle) since the low of the dump and while notable, for me the guide is when the 4hr chart no longer rides the EMA12 upwards. Bottom to top of the bounce is now 66%...
MNMD closed July 8th with the most bullish candle since May 19th, finally giving us a convining break of the daily equilibrium, and resulting in a gap up and run this morning with another solid day up over 3%. Today's high rejected from the top of the current high volume node mentioned in my weekend video (7.80), above this there isn't much resistance until the...
ATAI has been consolidating sideways on the daily chart for the last 5 days, in a confined channel on the 4hr chart. The channel levels are denoted by yellow dotted lines. This consolidation remains constructive above the last weekly resistance at 2.64, denoted by the solid white line. There is a LOT of volume being traded here (check it out yourself using...
