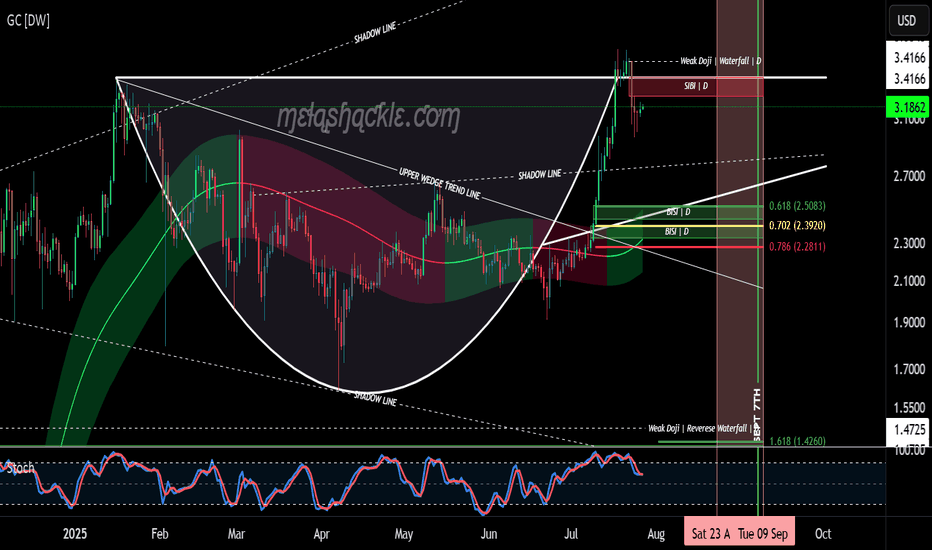
XRP is now forming the handle on a very nice cup-and-handle pattern on the daily chart, starting at the previous all-time high set on January 16th, 2025. But this pattern isn’t all sunshine and rainbows. The price of XRP could drop down into the $2.50 range—toward the bullish fair value gaps I’ve outlined at the bottom of the handle—before making any credible...
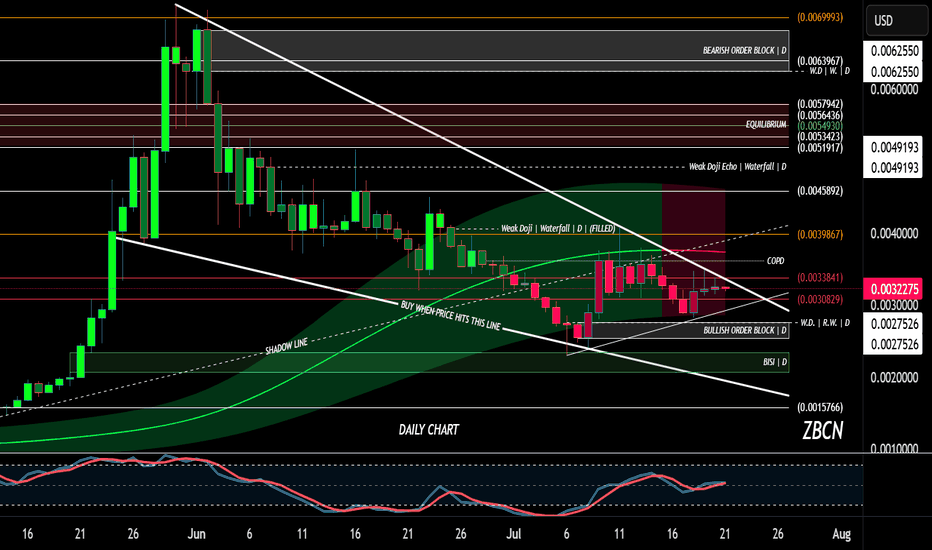
Few crypto investors have heard of or understand ZBCN or its potential in the coming global digital financial system, but it's very likely to change many aspects of how payrolls are conducted throughout global businesses—both large and small. I believe we will see ZBCN pull back down to the lower wedge trendline, as it finishes filling the lower gaps you can see...
XRP has been doing its best impression of a yo-yo for quite some time now, but as you can see, XRP is also now showing a nice Reverse Dragon Pattern on the daily chart, which has the potential to be extremely bullish in the short to mid term. The Dragon’s head is now forming on the daily chart, just above the upper trendline and, as I’ve discussed with my...
This chart looks very interesting and contains many little tidbits of information about potential future outcomes. I see good things coming for LINK in the future. Good luck, and always use a stop-loss!
Bitcoin is now trading within my equilibrium zone. This will be one to watch for clues about the broader market, as it's currently leading the way. Good luck, and always use a stop-loss!
XLM, which has historically traded closely with XRP, will be one of the big winners during the upcoming breakout in May—potentially continuing into June, July, and even August. Good luck, and always use a stop-loss!
Hedera's technology is leaps and bounds ahead of nearly every other crypto in the space, both in terms of current capabilities and future potential. If you own crypto, you'd be crazy, in my opinion, not to hold HBAR. Good luck, and always use a stop-loss!
XCN is a speculative play, and in my opinion, speculative plays should never exceed more than 15% of your overall portfolio, as they can be very risky. That said, as far as speculative plays go, XCN is my top spec pick. Good luck, and always use a stop-loss!
ONDO has an incredibly bright future, and people are going to regret not owning it on a level rivaled only by Bitcoin. Good luck, and always use a stop-loss!
POLYGON is now trading outside the upper trendline of the descending wedge pattern and may be preparing for a substantial move in the month of May. Good luck, and always use a stop-loss!
QNT is now starting to trade outside the upper trendline of the descending wedge and is likely to make an attempt to move toward the equilibrium zone—or close to it. This will be interesting to watch. Good luck, and always use a stop-loss!
XRP has been struggling to gain a significant amount of ground and is, in my opinion, one of the most heavily manipulated cryptos in the entire cryptosphere. That should tell you something about its long-term potential if the powers that be are willing to put so much time and effort into keeping its price suppressed. Good luck, and always use a stop-loss!
As many of us already know, SUI has the ability to make some really big moves very quickly, and it's currently trading at the bottom of the equilibrium zone. This will be very interesting to watch. Good luck, and always use a stop-loss!
XRP has just punched through the inverse head and shoulders pattern neck line, but I can't help but think this is a smaller part of a larger pattern (marked in white). Good luck, and always use a stop loss!
Here is a copy of my latest XRP chart with my April 'flash crash' thesis that I've been discussing with my community for the past month or so. Good luck!
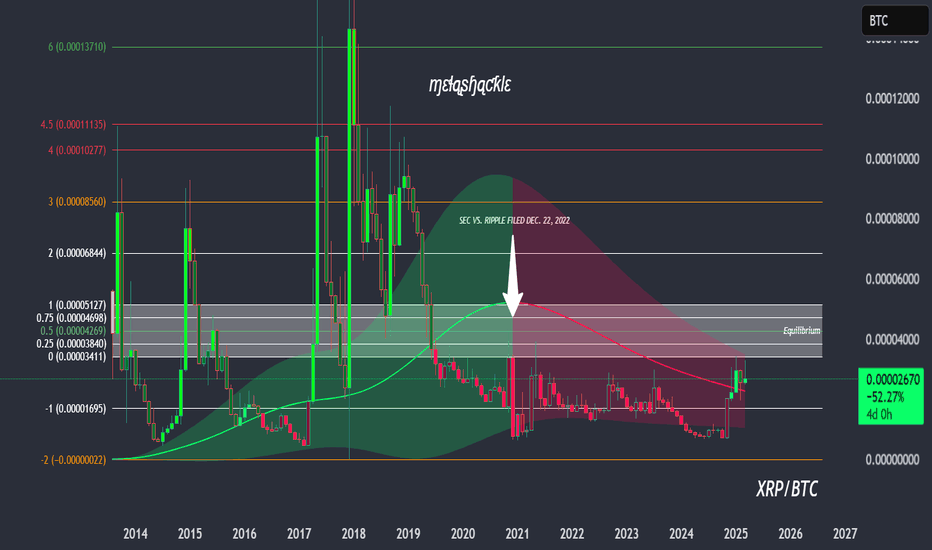
Here is a copy of my XRP/BTC chart that I've talked about recently, with my equilibrium zone.
Here is a copy of my XRP/ETH chart that I've talked about recently, with my equilibrium zone.
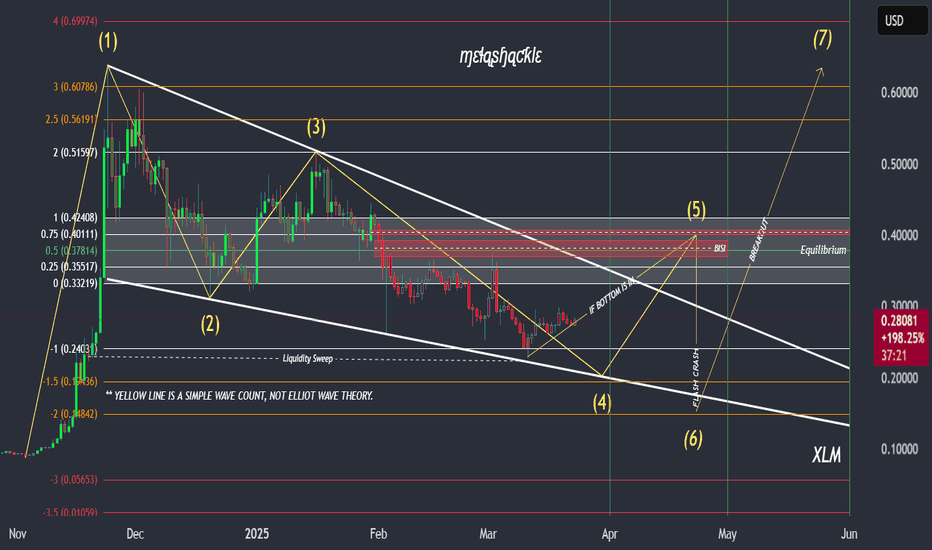
Here's my latest XLM chart, which includes potential levels that could be hit, along with an alternative path for the 5th wave, assuming the bottom is already in on the chart. - If wave 4 is already complete, then the wave 6 "flash crash" low would likely be higher than the chart shows. - If wave 4 isn't complete, then the wave 6 "flash crash" would likely sweep...


