This is a pretty good setup when taking everything into consideration. BOC on Wednesday likely to add additional strength to the Loonie from the tariffs. Earnings also adds more fire power towards this pair gaining in value along with Gold, looks like it wants to top off.
Waiting for a bullish pullback to sell around the 1.29 handle. Trade Safe - Trade Well. God Bless...
Potential head and shoulders build up for EURUSD with the latest sentiment from Trump and is continuation pattern with the tariffs. This Friday earning season kicks off which may soften EURUSD from dropping off a cliff. Also talks of 1.25% cuts from the Fed by year end may add some additional cushion for this pair. For this reason, my downside target remains on...
BTC trading in a descending channel on the daily timeframe. Trade wars are weighing down equities as well as Bitcoin. Until the tariff narrative changes, expect further downside with BTC. Trade Safe - Trade Well. DM for account management ~Michael Harding
Inflation Hot in the US, while the UK CPI cooling off. Dump it
Inflation is hot in the United States, dollar will strengthen. UK likely to weaken in the days ahead... Now's the time to sell. Trust me...
Stocks likely to drop lower, inflation is still hot. Trade Safe - Trade Well.
Stirling very likely to weaken when you analyze all fundamentals, sentiment and technicals. Trade Safe - Trade Well
Waiting for AUDCAD to reach the level I plotted on the chart to sell it. Leave a comment below, let me know what you think. Share with friends. Check out my profile for more awesome trade plans and setups. DM for copy trading, use any regulated FX broker. Trade Safe - Trade Well ~Michael Harding
Let's see what happens with the upcoming CPI data from the UK. In the event figures come in less than analyst forecast, guess what?? Well this pair will go south! Why well Fed's comments last week were not dovish, tariffs are still causing inflation providing strength and stability for the greenback. Waiting for UK CPI data to confirm my analysis. Leave a...
Taking a look at the daily chart, EURUSD is resting at a minor pivot point. However, I suspect further weakness based off comments from the Fed last week and with all eyes on this Friday's PCE report. Leave a comment below, let me know what you think. Share with friends. Check out my profile for more awesome trade plans and setups. DM for copy trading, use any...
If risk-on sentiment prevails, I expect to see further upside with EURJPY towards the 165 handle. Should technicals breaks back below the most recent bullish breakout, I most likely will lose confidence confidence and trim my lose. For now, I'm bullish ~ Know thy self Leave a comment below, let me know what you think. Share with friends. Check out my profile for...
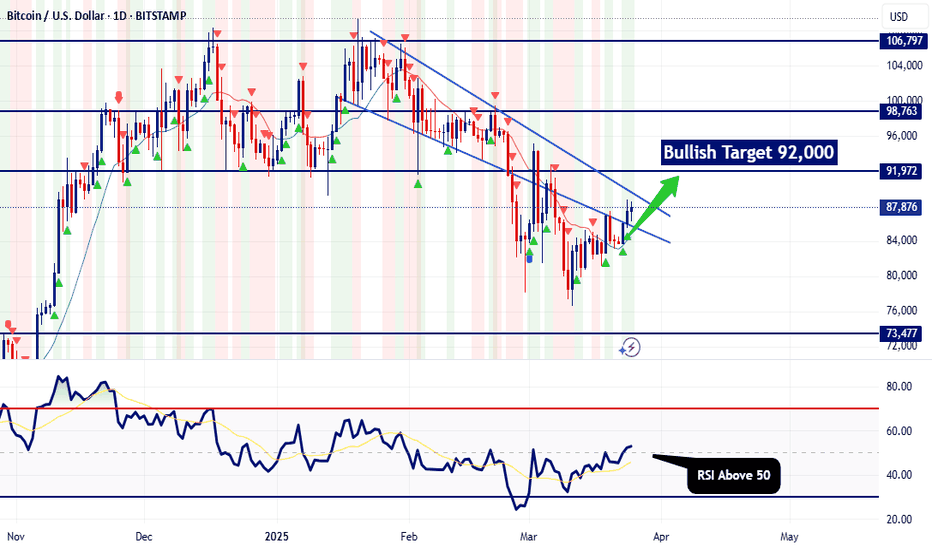
Taking a look at the daily chart, BTCUSD is now above 88k and I'm expecting further upside towards 92k, This week we have PCE inflation data from the US on Friday. Should inflation come in weaker then analyst forecast, that should weaken the dollar and thus power up Bitcoin. We will have to wait and see what happens but as of right now, technicals are indicating...
Taking a look at AUDNZD on the daily timeframe, price action has pulled back to a key level of resistance. Unless something significant happens, there's no rational or fundamental reason for this pair to breakout to the upside. For this reason, I'm interested in short selling this pair. Leave a comment below, let me know what you think. Share with friends. Check...
Taking a look at the daily chart, AUDCHF has began showing indications of a potential bottom. This might be a decent low risk LONG setup as a swing trade. Leave a comment below, let me know what you think. Share with friends. Check out my profile for more awesome trade plans and setups. DM for account management Trade Safe - Trade Well ~Michael Harding
Looking to go short. Waiting for slight pullback to upside to then sell. Leave a comment below, let me know what you think. Share with friends. Check out my profile for more awesome trade plans and setups Trade Safe - Trade Well. ~Michael Harding CEO at LEFTURN
Looking to go short. Waiting for slight pullback to upside to then sell. Leave a comment below, let me know what you think. Share with friends. Check out my profile for more awesome trade plans and setups Trade Safe - Trade Well. ~Michael Harding CEO at LEFTURN
Looking to go short. Waiting for slight pullback to upside to then sell. Leave a comment below, let me know what you think. Share with friends. Check out my profile for more awesome trade plans and setups Trade Safe - Trade Well. ~Michael Harding CEO at LEFTURN


