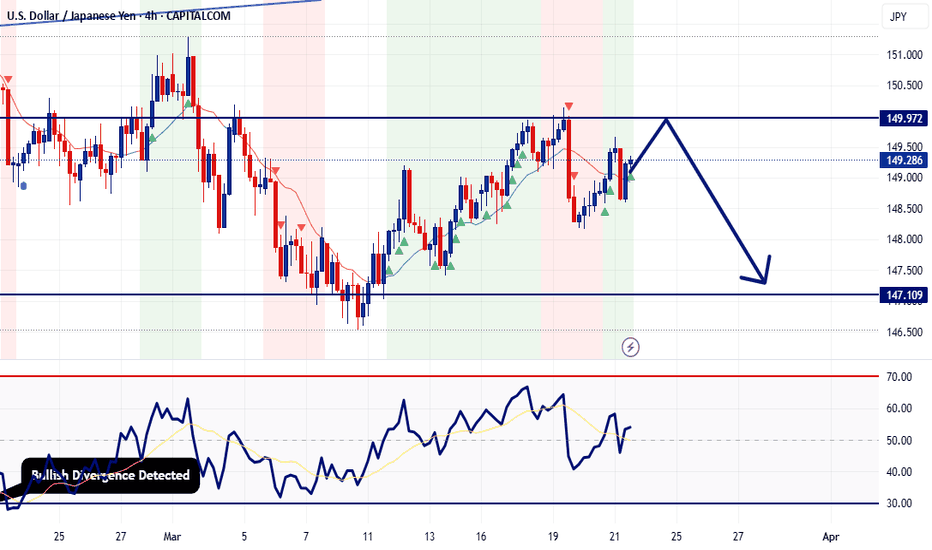
Looking to go short. Waiting for slight pullback to upside to then sell. Leave a comment below, let me know what you think. Share with friends. Check out my profile for more awesome trade plans and setups Trade Safe - Trade Well. ~Michael Harding CEO at LEFTURN
Looking to go short. Waiting for slight pullback to upside to then sell. Leave a comment below, let me know what you think. Share with friends. Check out my profile for more awesome trade plans and setups Trade Safe - Trade Well. ~Michael Harding CEO at LEFTURN
Looking to go short. Waiting for slight pullback to upside to then sell. Leave a comment below, let me know what you think. Share with friends. Check out my profile for more awesome trade plans and setups Trade Safe - Trade Well. ~Michael Harding CEO at LEFTURN
Summary of positions I'm looking to take next week with my Copy Trading program include the following: AUDCAD - LONG ⬆️ 🟢 AUDNZD - SHORT ⬇️ 🔴 NZDCAD - LONG ⬆️ 🟢 US30 - SHORT ⬇️ 🔴 USDCHF - SHORT ⬇️ 🔴 For optimal risk management, it's best to always scale with small volume relative to your equity. Leave lots of available margin on your account. Diversifying with...
Strong selloffs usually have a pullback with a possible opportunity to enter on the continuation trend to the downside. With US30, I'm waiting for this setup to play out to short sell in the upcoming trading week. Trade Safe ~Michael Harding
Possible long scalp opportunity for those that enjoy a simple 10-20 pips
Just based on simple TA, I foresee this pair moving in a similar direction as displayed on the chart. Let's see accurate I am at future forecasting this pair. That's it - That's all Trade Safe.
Just a quick update regarding gold. Yesterday we had better than expected CPI data followed by a strong sell off with Gold for the precious metal to then later regain all of those loses. Will gold continue to push higher towards 3000 an ounce? Or.. will we start to see some topping action and a bit of a correction? For now, I'm anticipating some topping action...
Taking a look at XAUUSD on the daily timeframe, RSI is well in the overbought territory. Does this suggest that gold might begin to pullback a bit in the days ahead? Let's take a look at the weekly chart. The above chart shows bearish divergence with RSI and price action suggesting that prices may also drop in the upcoming days or weeks.
Taking a look at the 15min timeframe, price action is beginning to create a second bearish leg to the downside. Currently just waiting for this second leg to stall out to seek a bullish scalp to the upside. That's it - That's all Trade Safe
Just a simple TA using conventional wave length projections. This pair wasn't able to hold onto the 78.6% fib pullback level so now I anticipate this pair first retesting around the 1.74 handle. Following the retest I would expect a natural bounce from profit taking and buyers heading into the market, but then I can foresee this pair breaking support heading...
Taking a look at my chart on the monthly for most people you will not understand my strategy at first glance, so ignore the first chart, and let's dive into my top down analysis. Let's Begin..... Starting with the Monthly. Chart Below Key Takeaways == Technicals == * Bearish RSI divergence * RSI is also overbought Technical Summary * I believe this pair...
This is on the daily timeframe. Let me know what you guys think...
I always try to spot low risk setups and Bitcoin right now is signaling just that on the long side.
Taking a look at the monthly timeframe, if you look back in the past, whenever we had a strong bearish engulfing candle, there was usually a second bearish candle afterwards. I believe there is a great chance that this pair will break below the green ascending trendline and eventually reach 130. Some key comments made last night from the BoJ's Governor Ueda: ...
Starting with the weekly timeframe, there's some quite noticable bearish Divergence with price action and RSI leading me to believe prices may continue further south. Let's take a look at the daily timeframe. On the daily timeframe, I have 2 bearish targets but first I need to see a bit of a pullback towards the descending level of resistance. Reason I'm...
Last week PCE came in hot and the Fed is very unlikely to cut rates this year. Forget about what you hear in the news about possible rate cuts. It's not happening... I'm bullish dollar, short stocks, short gold, and short BTC. Trade Safe
Taking a look at the 4 hour timeframe, price action attempted to break and hold above the high timeframe resistance. However following the 4H rejection candle, prices began to drop towards the ascending support. Question now is.. will this ascending support break and hold. ATR and RSI are both giving us early clues that it will. Trade Safe


