Mike-Ma
see from the chart. 1 target 53.5 2 target 58~60, 3 target 75
see the chart, it will go straightforward to 24.40, then will have a 0.382 back-trace, at last ,it will go to 25
from the chart we can see that the right shoulder is ready after it test the 0.618 risistant point 91.6, next risistant point is 92.5
the WTI Oil price will go follow the AB=CD , the target is 53 .5, then back to test the ristant 50.22. after that , it will go to 58. see the chart
although , the WFT will go up . but seems we have a short put oppprtunity, target should at 4.25
X has 80% possibility to go down. see the chart. it will go to touch the bottom which generated at 2016/1, this down trend will until 2018/1
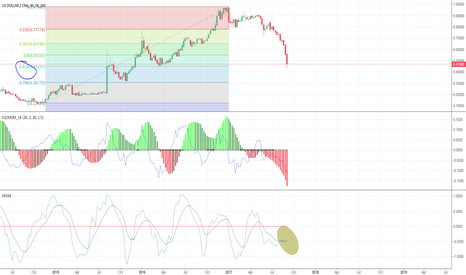
no mattaer from the day level or the week level , DXY already have the opportunity to rebound. from day level m it should been gennerate the righ shoulder of the bottom-head-shoulder structure. and from week level, the SRDM is going to through the zero line. it is time to buy. the target of this rebound can be about 96, i think, need to trace.


