MikeMoh
"Symmetrical Triangle" - Starting from 14 Aug btc failed to make a lower low. - The same thing happened again a few days back on 8 sep. - on 23 July " the false break-out " btc failed to make a higher high - on 5 sep Btc also failed to make a higher high. many people look at Symmetrical Triangle as a (Continuation) pattern. but that's not always the case. ...
buy at break out UP first target is BLUE line ! SL is a close below trend line ( green) if it breaks below , you can re-buy at red horizontal support line.
looking at the latest BTC analysis i was so optimistic for calling a bullish market as long as we have stayed above the main and only trend line which has been holding very strong for just about a year now. now that we did break and closed badly below it. we are 100% in a bear market no questions asked !. the reason why i am 99.9% sure that btc will still dip...
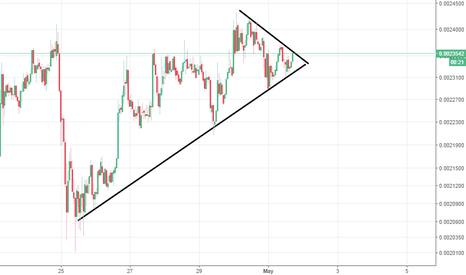
Wait for a triangle break out. upper side > target 7900$ down side > target 6900$ wait for a break out before entering.
This is an update for I call this hidden uptrend ! simply because i do not see many traders use this trend in their analysis. you can see how strong this uptrend is ! see how many times it rejected the prices ! and i mentioned early that this trend has a big potential to be the BASE line of the BTC move. as long as long as the price doesn't close below this...
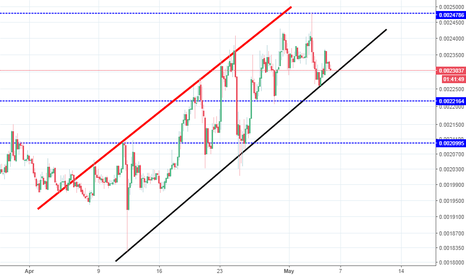
After the BTC spike, most alts fell down, ETC did fall below an important support, thus a new charting is important. here it is. BTC is still trading withing an ascending chanel, if we break below the buttom trend then a big fall will follow, as long as we stay above it, we heading north for the next run. your SL must be right under the trend line " candle close"
Hello BITCOIN lovers !! so my overall prediction on BTC is being going quite accurate so far ( check prev ideas). the new trend line "GREEN" is been holding quite well. price bounces back of that line couple of times. it is safe to say that the current moment is BULLSHIT. it will still be bullish until a daily candle closes below that trend. then things could get...
the red dotted trend line is EOS strongest support and it's ranging very near ! it's either you long now or wait for (if ever) price to test the trend line. this is a very MAJOR trend line, if we break below , a huge dip will follow, but the chart now seems like it's telling us the EOS is ready to move up !. keep a close eye, your SL should be a candle close...
wait for a braek out, "soon" go long, enjoy the profit !
wait for a confirmation on the break, go long. SL under the uptrend ( down side of the triangle )
if we break out the triangle, we will see a good spike up. watch it !
common sense says the EOS must correct to at least the blue horiztal support line ! but on the chart it seems like it's breaking out of this triangle formation !! if it does, it may BOOST again.!! if it breaks the uptrend in black " downside" of triangle then wait for a buy a signal......
not the best trade you can make,, but the support area is kinda holding , buy with a sl under the support lines . target would be the last high.
wait for a brak out of this triangle. go long . first target is the blue line. SL right under the up trend.


