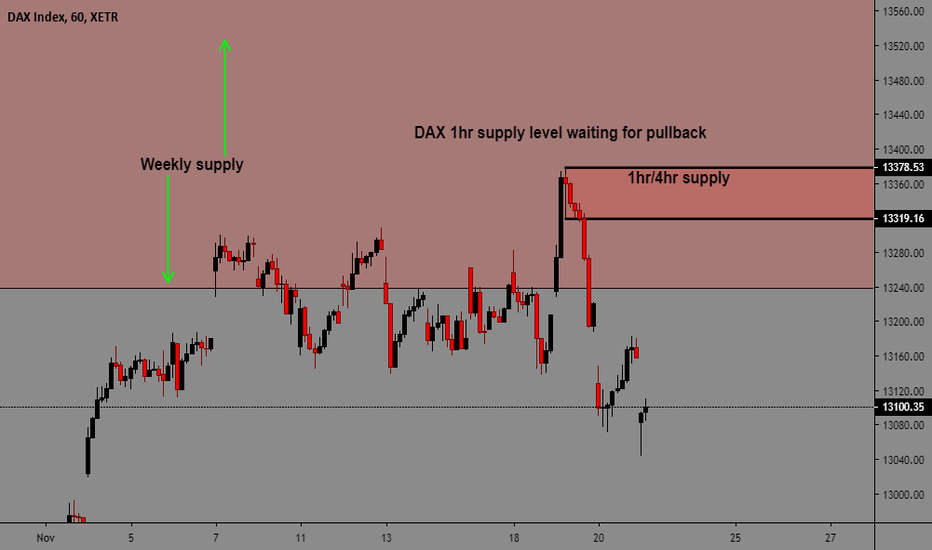
Please see chart for supply and demand zones. Those S/D areas are where im interested in doing business.
Daily downtrend waiting for pullback into supply before looking for shorts. Hopefully the Stock market can give a correlations trade.
Prices reacting off of weekly demand + daily confirmation and now we have prices back into daily demand.
Please see picture for analysis.
Prices are inside daily/4hr supply zone in a daily downtrend. Here im waiting for selling opportunities.
-daily demand holding price but notice the price action on the daily TF. -Every time price comes down into demand a smaller reaction takes place every time. -price getting squeezed. -Watch Sunday meeting for analysis.
This is a chart posted by someone in my group.. love it.
Here is a level where i got long on the EU, price inside a daily demand + confirmation. See my youtube :moneyball austin for more analysis
Question during my cooking show live stream was how do i determine a trap or a fake out? First of all i think everyone that trades a different methodology determines a fake out in their own way depending on their methodology the retail traders trades. Using the Supply demand methodology i explain how i determine traps. When i pull up a chart and i see an area...
Please read photo for analysis. Prices in a weekly uptrend, inside weekly supply so i want to be looking for sells. Prices on the 4hr showing me a significant imbalance on the 4hr timeframe.
this is just a picture of bitcoin on how i use supply and demand to read the market.
thought i would post a trade that i got in today.
Please see picture of analysis, comments welcome!.
please see picture for analysis. Cheers
please see chart for analysis
please look at the picture of analysis thanks.
Please look at the picture for my analysis. cheers
sellers clearly stepped in with price reacting off of weekly supply.


