See picture for analysis. feel free to share your thoughts.
See chart for analysis. both supply and demand zones are areas to watch.
See Picture For Analysis. The strategy used for this is supply and demand.
See chart for analysis. Price has never broken 200MA. Waiting for buyers to step into the market by watching smaller timeframes. We have support and resistance lines here with supply and demand zones. Thoughts?
-Weekly uptrend -Price inside weekly/daily demand. -Currently price is located in a good area for longs with confirmation. (see picture for the idea) -Shorts = -Wait for price to hit the previous drop base drop supply/ resistance/ 200MA -Look for shorts with confirmaiton. (see picture for analysis)
See Picture For Analysis. Let me know any thoughts.
See picture for full analysis. Let me know your thoughts?
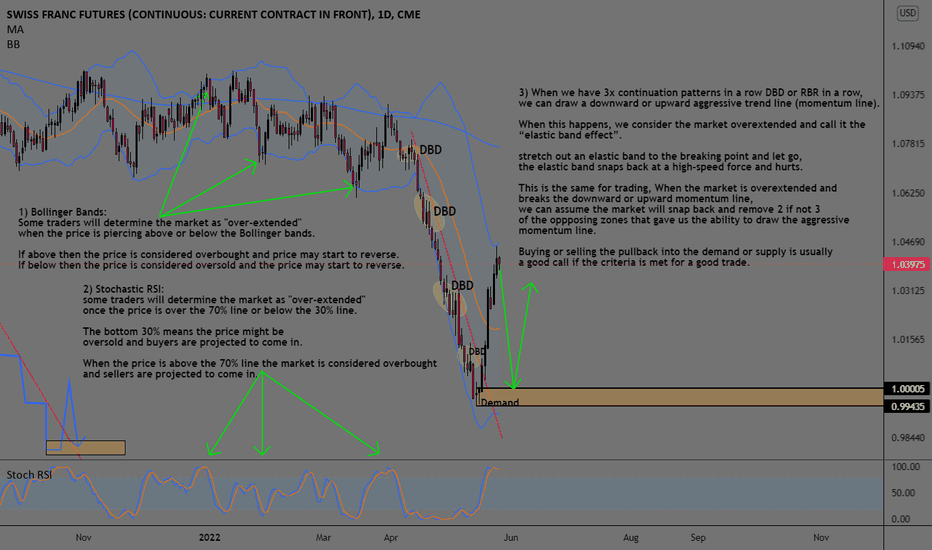
1) Bollinger Bands: Some traders will determine the market as "over-extended" when the price is piercing above or below the Bollinger bands. If above then the price is considered overbought and price may start to reverse. If below then the price is considered oversold and the price may start to reverse. 2) Stochastic RSI: some traders will determine the...
See picture for analysis Feel free to share you thought.
See picture for analysis Evidence for Longs Pros: 1) bullish with inflation 2) food shortages 3) potential storms going into summer which might kill coffee beans. 4) Trend = Uptrend so any longs will be trending. Cons: 1) Price below + reacting off of the 200MA 2) hard to scalp on lower timeframes + commissions/ swaps can be high.
-CHF very weak currency. I'm not about to go and call the bottom of the and neither should anyone. What I notice is price has created 4x DBD supply zones in a row which allows us to consider the market overextended, and we have the ability to draw an aggressive downward ML. -Waiting for price to have the "elastic band effect" and have price shoot up and break the...
Analysis: -Trend = uptrend so any shorts will be counter-trend. -Price inside weekly DBD Supply -Price reacting off of 200MA -Price reacting off of resistance line -Any shorts would be against the strongest currency (USD) See picture for analysis.
Please see the chart for analysis. -price reacting off of support/demand. -Price has never broken a monthly demand. -Waiting for lower timeframe confirmation (breaking ML / removing opposing pivot point). -I could see price-breaking support/demand as it would spike a lot of headlines about bitcoin being a bad investment.
Please see picture for analysis. -Price is reacting off of demand/support that's been holding for 2 years now. -Still a very high demand for REAL physical silver. -Waiting for confirmation. Thoughts? if you like it don't forget to hit the like =)
See the Picture for analysis! Just drawing out some zones that would of interested me based on my trading style. thought?
See Picture Short for analysis.. Thoughts? I love gold for buying so this woud be a small risk.
See Picture for analysis. Feel free to share your thoughts. --Ausitn
See the chart for analysis/trade review. Feel free to share your thoughts.


