MonsterTurtle
ASII is a retail favorite LQ45 stocks, including me. But a few days ago, I decided to sell ASII with loss. Here is the reasons: 1) After bouncing back from support at EMA100 and breaking EMA50, it turned out that ASII was unable to break through to EMA20 and turned back to EMA100. 2) When it fails to break EMA20 at 6275 and then goes down, the chart formation is...
WEGE Plan is attached on the chart May the profit be with us!
ASRI Plan is as attached on the chart May the profit be with us!
There is a potential inverted head and shoulder chart pattern. If confirmed, it can be observed if the price breaks 1140.
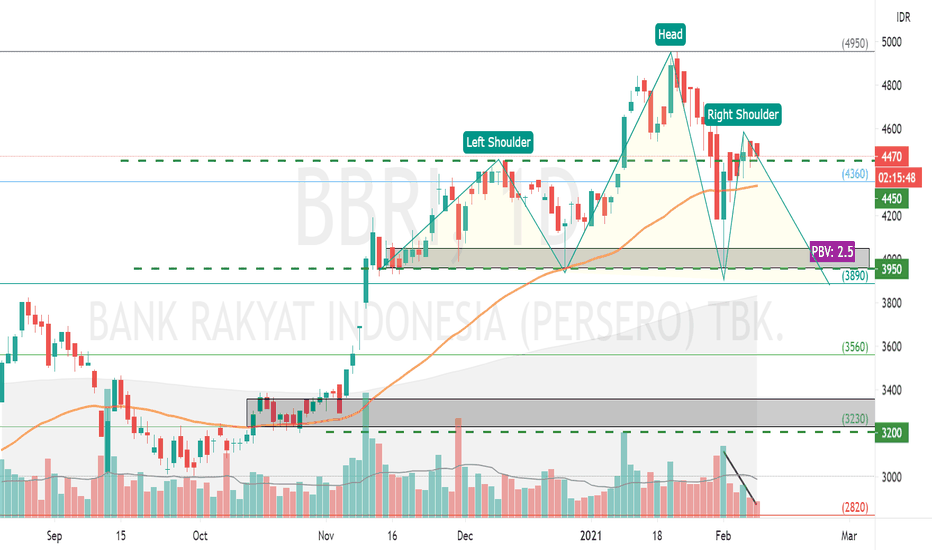
BBRI has the potential to form a Head and Should chart pattern. By looking at last week's movement pattern where the volume at the break of 4470 resistance was not big enough and the trend decreased afterwards, it would be better to wait for confirmation before entry. Possible short-term movement is still sideways. From the market maker movement side, BBRI is one...
BUY Target1 400 Target2 450 PBV 0,91 PER 42
Buy range: 715-730 Target 1: 800 Target 2: 850 Target 3: 950 Proportion of Domestic vs Foreign Brokers : 57% vs 43% (Both is in accumulation mode)
Scenarios for PTBA 1. If preclosing break resistance 2620 with high volume, Buy on Breakout, nearest TP is 2800 2. If the price drops, bid below between 2500-2600 For short term, please watch the S/R on the chart. For long term, it's safe to take the current price.


