beyondta
gann
trendanalysis
Less Tags
Show All Tags
All Types
Type
All Types
Indicators
Strategies
Libraries
All Accesses
Script access
All Accesses
Open
Protected
Invite-only
Public & Private
Privacy
Public & Private
Public
Private
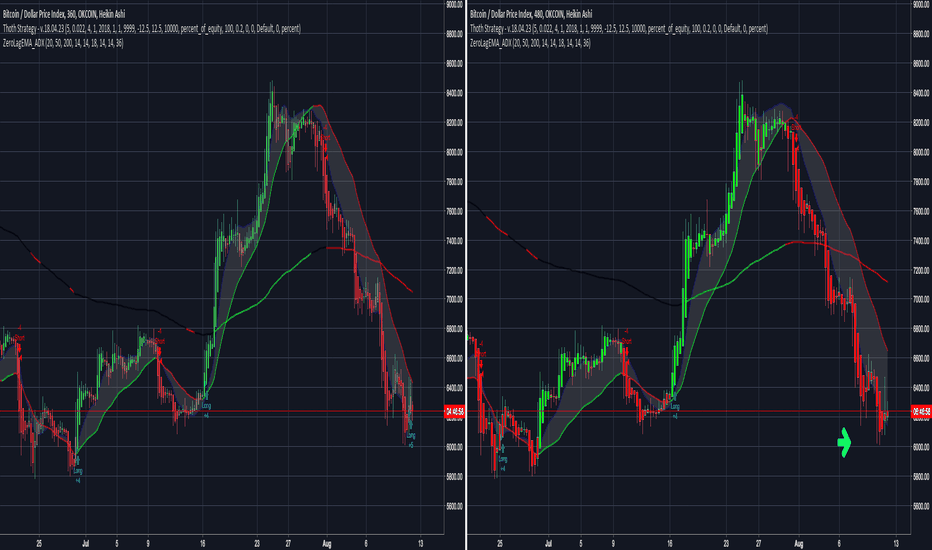
The newer chart was opened to test other timeframes, but I happened to notice the 8 Hour chart has no "Long" . The difference seems to have occurred after the BTC price dropped severely.
3
For August we may see a few upticks with an overall trend down to test critical support levels at 6800 or lower. A failure to support at 6800 leads to 6400 - 5800 (again) with a possible range down to 5400 that last week of August, before our next long term uptrend. Any of this would change with ETF status updates or other coverage that adds interested buyers or...
4
110999
2165
341563
Message
Follow
Following
Unfollow
1160
95
4992
Message
Follow
Following
Unfollow
33627
1316
87041
Message
Follow
Following
Unfollow
46129
454
136330
Message
Follow
Following
Unfollow
233
117
1835
Message
Follow
Following
Unfollow
4743
27
2121
Message
Follow
Following
Unfollow
15859
1342
59792
Message
Follow
Following
Unfollow
486
127
3184
Message
Follow
Following
Unfollow
34
30
144
Message
Follow
Following
Unfollow
395
74
2318
Message
Follow
Following
Unfollow
248
42
564
Message
Follow
Following
Unfollow
5620
71
2604
Message
Follow
Following
Unfollow
242
5
0
Message
Follow
Following
Unfollow
18226
433
14799
Message
Follow
Following
Unfollow
12477
982
37588
Message
Follow
Following
Unfollow
179
5
113
Message
Follow
Following
Unfollow
Type
Script access
Privacy


