MtICHI
the pair has broken the trendline upward and is bullish now but before continuation of its move ,a pullback is probable this analysis is based on wolfe wave pattern and price action pattern please see what would happen
the pair is broken a key area downward on 4H time frame indicating bears are in control also a price action pattern named as double top is being seen on the south suggesting target could be in the vicinity of its formation as depicted on the chart . let'see what would happen as we suggest to enter short on the pullback to key level
the pair is in a triangle and we anticipate to hit both tps this pattern is a price action pattern in which a double top is being seen lets see what would happen
the pair is bouncing in a triangle and hit the sidelines seveal times and now upon reacting to upward trendline will head south let see the result
the pair is now bouncing in a triangle and we predict to move further down before going up trendline and fibo level for better understanding are drawn . we are waiting for the result
the pair is reacting to trendline for a while where we see some bullish candles above that then go south toward specified target . let see what would be the result of reaction
the pair is trying to break the level upward to reach next top .we are waiting for this break upward . please see what would be the result
the pair reacted to support level and will go upward toward fibo level we proposed this position with RRR>3 based on price action pattern and ichimikou tenkensen lets see the result
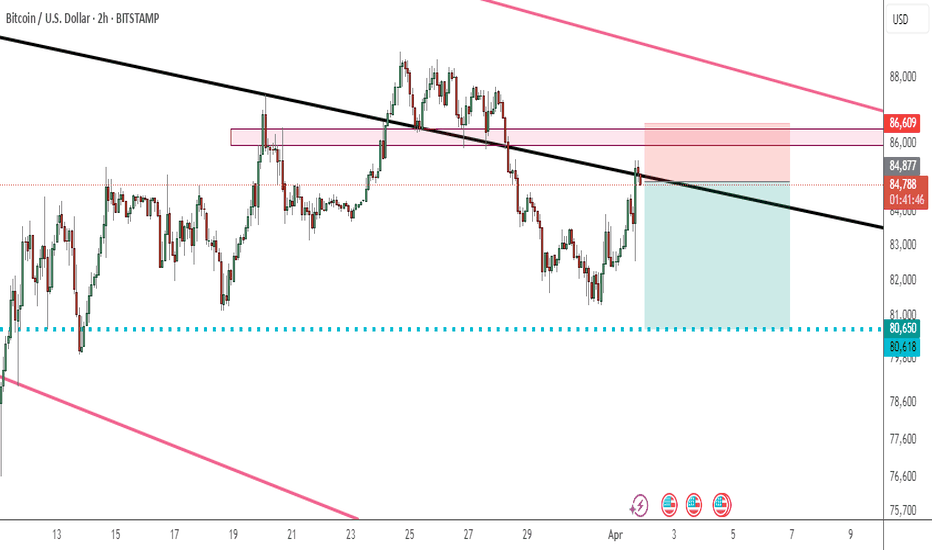
BTC is reacting to trendline and we proposed a short position toward specified tp a price action pattern for tp setting used let see market reaction
key levels are depicted on the chart and pair was bounced from its support level and trying to reach to its previous top long position proposed here stop and tp are specified on the chart and RRR >2 let see the result
observing double bottom at the end of downward move ,we suggest a buy position toward 76.4% fibo level for any correction RR is 2 let see the market reaction to our position my previous analysis :
the pair has already reacted to specified level on the chart and will go toward its tp we have seen several HH formed and then LH we proposed this short position with RRR>2
the pair is on the kijen level when we see 12H time frame and also on ema200 so we believe that the pair is getting strong support to attack to previous top once again RR>2 we are waiting for result
pair is reacting to trendline and is probable to go heading south according to price action pattern we are entering short with reward to risk ratio of 4 RR=4 let's see market reaction
a sell position upon market opening is proposed RR>2 a QM pattern is underway as reversal one levels depicted on the chart target is on the 76% fibo level lets see what would be the reaction
the pair is making HH and HL consecutively and now trying to make another HH toward upper level RR=2 we are suggesting this long position let see market reaction
reacting to trendline and on a key level ,we are suggesting entering short toward fibo level RR>3 let's see what will market reaction
Aussie made a LH after several HH's .this indicating that the pair is starting heading south . key levels are depicted on the chart a price action pattern below the price is observed for target setting let's see the market reaction


