Muhannadchart
EssentialALKS is trading near a strong support zone at 26.50 – 26.70, with technical indicators showing early signs of a potential bullish reversal on the daily chart. If the price breaks above 27.35 on a daily close, we expect momentum to push towards 28.36 and then 29.00. Trading Plan: • Buy Zone: 26.60 – 26.80 • Target 1: 28.36 • Target 2: 29.00 • Stop Loss: Daily...
NVO dropped hard (over 20%) mainly because of a legal issue. I think this is temporary and will get solved with time. The stock is now super oversold and sitting on strong support around $52–53. • Entry: $52–54 • Target 1: $56.90 • Target 2: $66.40 • Stop Loss: $50 If the issue clears, we could see a strong rebound and possibly a full recovery of this drop.
I feel like ORI could make a move soon. It bounced from the support area around 35.9 and closed above it with good trading volume. If the momentum continues, we might see it push toward 37 or even 38. • Target: 37 – 38 • Stop Loss: below 35.5
Qifu Technology (QFIN) experienced a sharp sell-off, bringing the stock down to $35, which aligns with a key support zone near $34.70. The heavy selling volume suggests capitulation, and historically, such moves are often followed by short-term technical rebounds. From a technical standpoint: • The stock is now trading well below major moving averages,...
Selective Insurance Group (SIGI) is showing early signs of a potential bullish reversal after a sharp sell-off. This week, the stock has rebounded strongly from recent lows, closing above the $81 mark with increased trading volume, indicating renewed buying interest. From a technical perspective: • The strong bounce from support near $80 suggests that selling...
HROW is trading around $37.8 and just broke a key resistance with solid volume. Momentum looks good and price is holding above EMAs. If this continues, I see it pushing toward $49 in the coming weeks. Stop loss below $27.5 Worth keeping an eye on 👀🔥
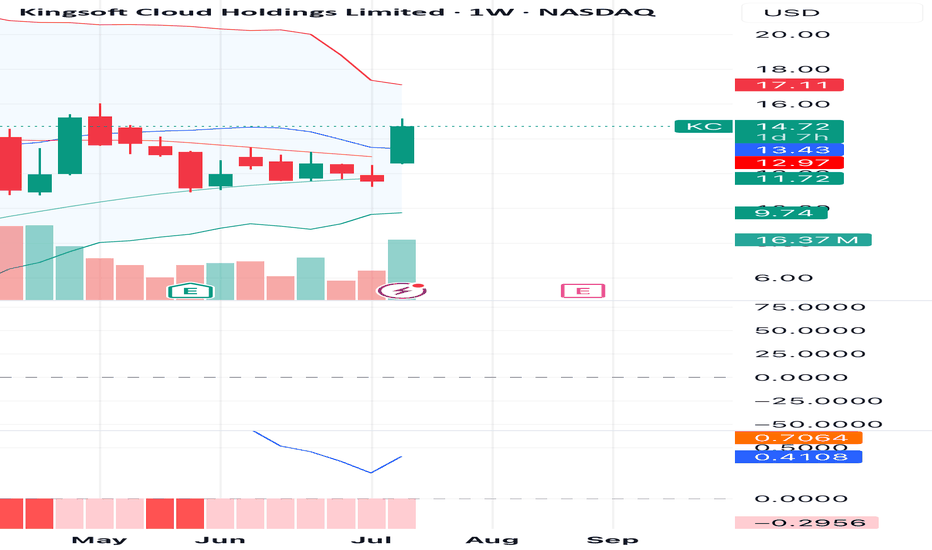
KC (Kingsoft Cloud Holdings) is showing a strong bullish reversal pattern on the weekly chart, breaking above the 20-week moving average for the first time in months with notable volume surge (16.13M). The breakout candle closed near the high of the week with a wide body, suggesting strength behind the move. The MACD is beginning to curl upward from the oversold...
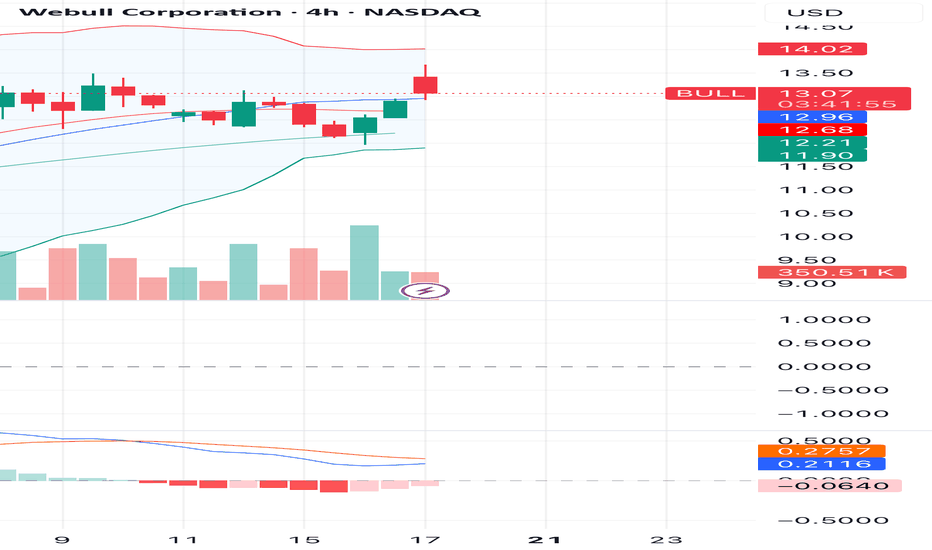
The 4H chart for Webull Corporation shows a strong bullish breakout candle above key moving averages, signaling potential for continued upside momentum. The price has closed above the middle Bollinger Band and is testing the upper band with increasing volume — a bullish sign supported by a recent uptick in MACD histogram. 🔹 Entry Point: $13.03 🔹 First Target...
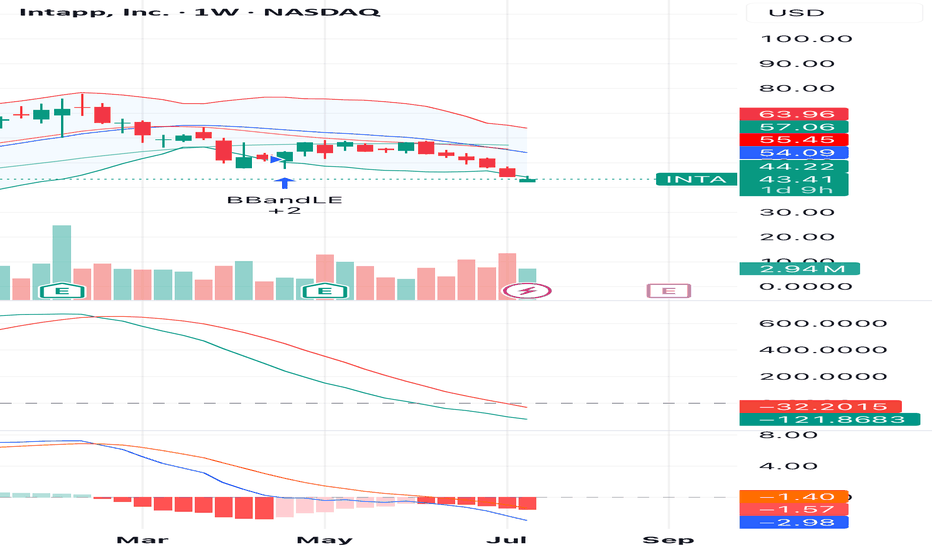
INTA is showing signs of a potential reversal after a consistent downtrend. On the weekly chart, the price touched the lower Bollinger Band with increased buying volume and a bullish candle forming. This may signal the end of the selling pressure. Momentum indicators such as MACD and KST are flattening, suggesting a possible shift in momentum. A break above...
• Current Price: $2.15 • Support level: $1.99 • Resistance level: $2.42 / $2.85 • Indicators: • Bollinger Bands show a potential reversal from the lower band. • MACD and momentum indicators are still weak but may show signs of convergence soon. • Volume is picking up, which may support a short-term move. Plan: • Consider gradual buying around $2.15, with...
Buy Idea – ARM Holdings (ARM) • Current price: $131.73 • First target: $135 • Second target: $140 • Stop loss: $128 The stock is trading sideways but is close to a support level at $128. If the price holds above $130 and trading volume picks up, it could move toward the next targets. ARM is a well-known company in chip design used in smartphones and other...
Airbnb (ABNB) is showing bullish continuation after reclaiming the $130 zone, holding above the middle Bollinger Band. MACD confirms a positive crossover, and increasing volume supports a potential move toward the $153 resistance. Trade Setup: • Entry Zone: $135 - $137 • First Target: $145 • Second Target: $153 • Stop Loss: Below $129 Technical Analysis...
SOFI is showing strength above the $13.50 level after bouncing off the middle Bollinger Band. Increasing volume and early MACD recovery suggest a potential continuation toward the next resistance at $17.50. Trade Setup: • Entry Zone: $13.50 - $13.80 • First Target: $15.50 • Second Target: $17.50 • Stop Loss: Below $12.80 Technical Analysis...
COIN (Coinbase) is showing strong bullish momentum after breaking above the $250 zone. The price is holding above the middle Bollinger Band with increasing volume. MACD is crossing to the upside, supporting further continuation toward the $317 resistance level. Trade Setup: • Entry Zone: $260 - $263 (Current Price) • First Target: $280 • Second Target:...
ROKU stock is showing signs of a potential rebound from the key support zone around 68-70, with early momentum improvement despite technical indicators still being in negative territory. A break and hold above the 73.73 resistance could confirm a short-to-medium term bullish move toward the major resistance at 96. Trade Setup: • Entry Zone: Between 70 and...


