📡 "Tower Break! Signal Caught at ₹400" 🚀 Chart Pattern: Falling Trendline Breakout + Range Break 📈 Current Price: ₹400.25 🎯 Target: ₹448.80 🛡️ Stoploss: ₹388.15 📊 Risk:Reward ≈ 1:3.75 🔍 Volume Spike confirms breakout 🔻 Accumulation between ₹360–₹395 now acting as base 💡 Trade Setup: After a long consolidation in a rectangular range, the price has broken out of...
RSI Cross + Rounding Base = Bullish Setup! 🔋🚀 🔍 Technical Breakdown Pattern: Rounding bottom formation after prolonged downtrend. Momentum Trigger: RSI breakout above 60 indicates fresh buying momentum. Volume: Steady build-up in volume—accumulation phase might be over. 📈 Trade Setup Entry: ₹372–₹373 (current breakout zone) Stop Loss: ...
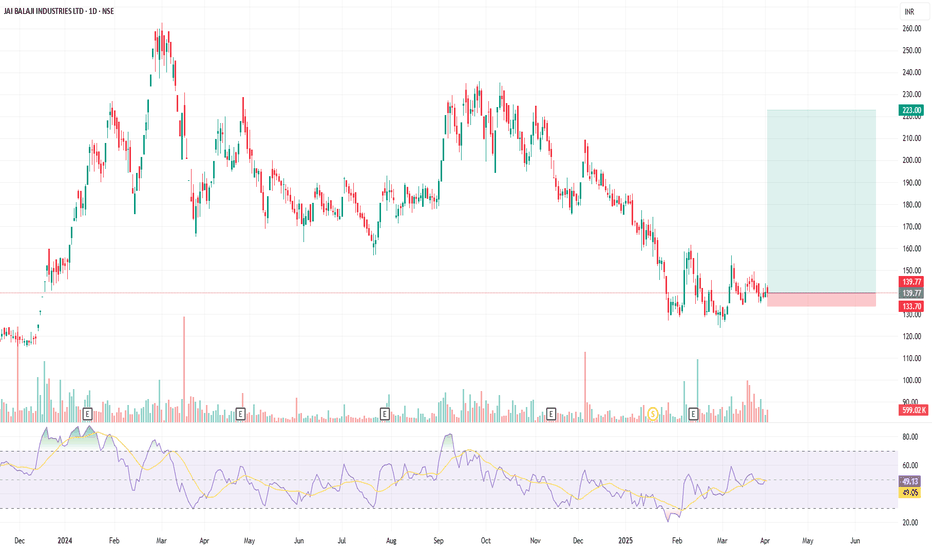
Chart Summary 📊 (as of April 2, 2025) Current Price: ₹139.77 Support Zone : ₹132–₹134 (marked in red on your chart) Resistance Zone: ₹150–₹155 (immediate), then ₹175+ RSI: 49.05 — Neutral, poised for either reversal or consolidation breakout Structure : Sideways consolidation after a strong downtrend; forming a potential base Trade Idea 🛠️: Positional...
Technical Analysis Chart Observations: Price: Closed at ₹151.53 Candle: Strong green candle, breaking recent resistance Volume: Healthy volume (approx. 4.92M) — confirms price action RSI: 61.59 — bullish but not yet overbought, still room to go Structure : Ascending structure since early Feb 2025 — higher highs and higher lows forming. Key...
Timeframe: 4H Chart Technical Analysis: Falling Channel Breakout Setup : The stock has been trading inside a downward-sloping channel. A breakout from this channel could lead to a strong upward move. Key Levels: Entry Zone: Around ₹1,540 - ₹1,560 (Breakout confirmation above resistance). Stop Loss (SL): Below ₹1,468 (Last swing low). Target Levels...
Observations: Ascending Trendline Support: Price is respecting an ascending orange trendline, acting as dynamic support. This trendline has been tested multiple times, showing strong bullish interest. Bullish Falling Wedge: A falling wedge pattern is forming, indicating a possible bullish breakout. Breakout confirmation would signal potential...
Implications of the Pattern: Market Psychology: The expanding triangle reflects growing uncertainty and volatility, often seen during periods of fundamental shifts or major market news. Breakout Potential: The pattern typically resolves in the direction of the prevailing trend (upward in this case, given the stock's long-term ascending channel). ...


