MyTradingJournal6th
PremiumPattern: Symmetrical triangle within consolidation. Range: ~102K–104K. Bias: Bullish — supported by higher lows and EMA structure. Indicators: RSI near 53 – neutral with slight upside bias. Volume compressing – typical before breakout. ADX suggests a possible move soon. Follow for more real-time updates and analysis!
Description: Bitcoin is showing a clear continuation pattern on both the daily and weekly timeframes, supported by strong trend structure and healthy consolidation. After breaking out of a long-range accumulation zone (60K–72K), BTC has maintained its position above critical levels and is now forming a bullish flag/pennant just below a major resistance band...
Description: Bitcoin is showing a clear continuation pattern on both the daily and weekly timeframes, supported by strong trend structure and healthy consolidation. After breaking out of a long-range accumulation zone (60K–72K), BTC has maintained its position above critical levels and is now forming a bullish flag/pennant just below a major resistance band...
Bitcoin has been on an impressive run lately, reclaiming levels above 100K and showing strong bullish structure across higher timeframes. But now it’s approaching a major resistance zone near 104K–105K, and the price action is starting to look like it’s at a crossroads. What the Charts Are Telling Us: 🔹 Daily Timeframe: BTC is currently hugging the top of a...
Idea: Bitcoin has broken out of a prolonged accumulation range with strong bullish confirmation across multiple timeframes. The price has reclaimed structure above GETTEX:98K and is pushing higher within a rising channel. This sets the stage for a potential move towards the $106K–$110K zone. Why: Confirmed Break of Structure (BOS) and Change of Character...
Trend: Bullish, inside a rising parallel channel. Price: ~$93,767, facing resistance near $95K–$100K. Support Zones: 88K, $80K, $73K. Breakout: Confirmed from descending wedge; above major EMAs. RSI: Neutral-bullish (~57), room for upside. ADX/DMI: Positive trend, but flattening—watch for momentum shift. Volume: Declining—needs breakout confirmation with strong...
Trend: Bullish, inside a rising parallel channel. Price: ~$93,767, facing resistance near $95K–$100K. Support Zones: FWB:88K , $80K, $73K. Breakout: Confirmed from descending wedge; above major EMAs. RSI: Neutral-bullish (~57), room for upside. ADX/DMI: Positive trend, but flattening—watch for momentum shift. Volume: Declining—needs breakout...
4H Chart – Short-Term Bearish Price has clearly broken down from a rising wedge pattern with volume confirmation. RSI is trending downward (~36) and Parabolic SAR has flipped bearish. Expect potential continuation to the $91K–92K support zone. If momentum accelerates, gap-fill toward 88K remains in play. 1D Chart – Neutral to Weak Bullish Daily structure still...
Rising Wedge Pattern Identified – Price is currently trading within a rising wedge on the 4H chart, often considered a structure worth monitoring for potential volatility. Price Near Local Resistance (~ GETTEX:97K ) – BTC is reacting around the GETTEX:97K zone, a level where price has previously stalled, suggesting possible decision-making by market...
Bitcoin to $102K? Bullish Momentum Still in Play (4H Chart) Bitcoin is holding strong within an upward channel, showing clear bullish structure with higher highs and higher lows. After breaking out of a long consolidation phase, it’s now finding support around $94.5K and riding along the midline of the ascending trend. Momentum looks solid, with price above key...
BTC has seen a strong breakout and is showing good momentum, but we’re approaching a key resistance zone around $102,000 – so it's a good time to stay cautious. Trend and momentum indicators still look bullish RSI is nearing overbought territory Watch price action and volume closely near resistance No need to rush in here – let the chart guide you. Stay...
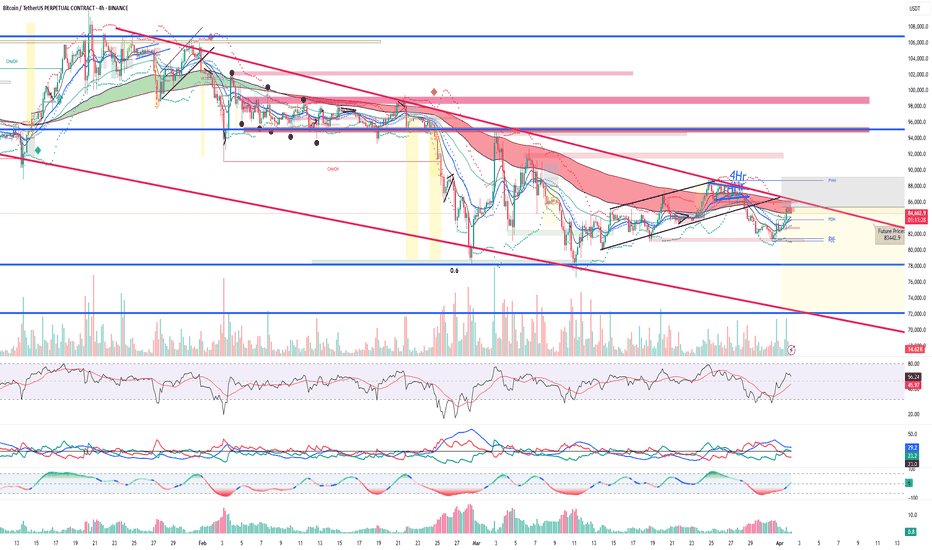
Bitcoin is forming lower highs within a descending wedge pattern, failing to reclaim the key resistance zone around 89K. The price is consistently rejecting from the upper wedge trendline, with weak bullish momentum as shown by flat RSI (~48) and ADX convergence. A breakdown from the current structure could trigger a bearish move. Volume is decreasing on...
Bullish Probability: 40% Bearish Probability: 60% Trend Structure: The market is currently in a downward channel, indicating bearish control unless a breakout occurs. Pattern Formation: A descending wedge is forming, which can act as a reversal pattern if confirmed. Momentum Indicators: RSI is below the mid-level, suggesting weak bullish strength. ADX shows...
Pattern: Descending Wedge (Bullish Potential) Major Resistance: Strong bearish pressure at key resistance level Volume Analysis: Weak buying volume on recovery, strong selling volume earlier Market Sentiment: Mixed with a slight bearish bias Technical Indicator Probability RSI: Neutral to Bearish (48.57) → 55% Bearish / 45% Bullish ADX & DMI: Weak trend, bears...
Resistance Rejection: Price rejected at a horizontal resistance zone, showing bearish pressure with wick formations indicating seller dominance. Trendline Respect: Price respects a descending trendline, supporting bearish continuation probabilities. EMA Confluence: Below the 50 EMA, signaling weakening bullish momentum. Volume Decline: Reduced buying volume...
Resistance Rejection: Price rejected at a horizontal resistance zone, showing bearish pressure with wick formations indicating seller dominance. Trendline Respect: Price respects a descending trendline, supporting bearish continuation probabilities. EMA Confluence: Below the 50 EMA, signaling weakening bullish momentum. Volume Decline: Reduced buying volume...
I’ve spotted something on the 30-minute chart that’s too intriguing to ignore. A red soldier candle has appeared, breaking through both the 20 and 200 EMAs like it owns the market. This is the kind of move that sets the tone for the next big decision point, and it’s exactly what my system has been waiting for. Why This Matters: When a candle like this emerges,...
The Ethereum (ETH/USDT) 4-hour chart showcases a classic symmetrical triangle pattern, signaling a potential breakout. The market is currently in consolidation, with price action coiling tightly within key trendlines. Here’s what stands out: Symmetrical Triangle Formation: ETH is trapped within lower highs and higher lows, forming a compression zone. A breakout...


