MysticBlubber
Some volatility with SCWX overall, consolidating now and looking to catch the uptrend. TTM might be winding up for more upside. Will try to catch it on the 0.5FIB. Putting stop below the lowest moving averages, and below the 0.618 FIB.
Looking to jump in on the uptrend. 0.618 Fib is at a price support and near uptrend line. Not really using the TTM or RSI indicators for this.
Zillow is down ~45% from this years peak, and almost back to the December 2018 dip. Recently, the SMA21 has been a rejection point; but price seems to be stabilizing and getting squeezed by that SMA21. RSI is increasing for bullish divergence, volume has a slight uptick. So could be ready to move up. Placing stop under current support. Price target 1) 0.236 FIB...
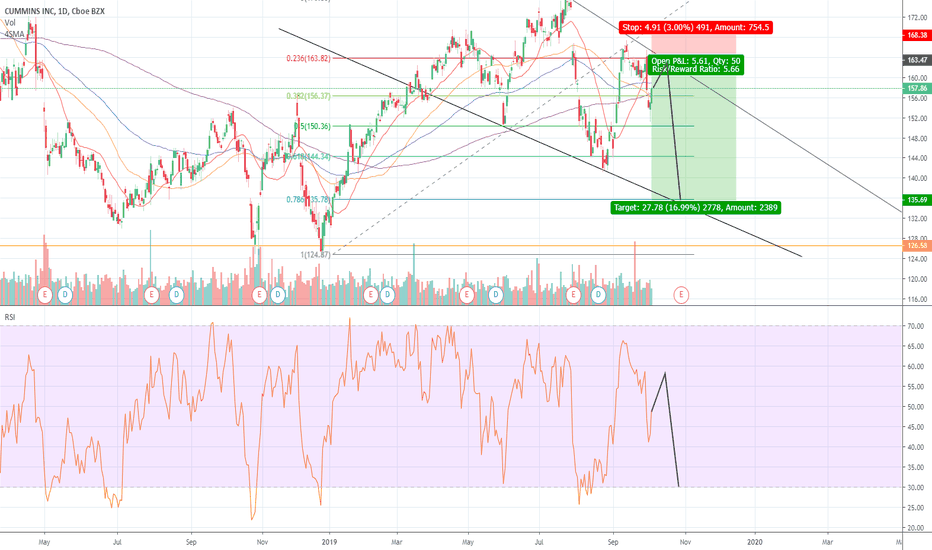
Trading off early identification of downward channel. Enter short at top of channel, with 3% stop loss for some tolerance against light chop outside the channel. Target is 0.786 retracement which aligns at the bottom of the channel upon financial release.
RGEN has been in a strong uptrend for a while, making a short a risky trade. Going to take a shot at it anyway. Basic idea is the SMAs are spread, giving them some time to meet up again. Shown in two blue circles, previously the price would dip just under the SMA200 before taking off again. The target is the 0.618 FIB retracement, which lines up with the SMA200...
ZIOP seems to be at a crossroads, will monitor to see if it gives a clearer direction of up or down. Price Up: Most of the chart shows "what if" for price up movement. The basic idea is the price has flattened for about a week, held up by the SMA200 and a historical price S&R line, whereas the RSI has been increasing. The price also wicked off the 0.618 Fib. So...
TVIX operating in a strong downward channel, right in the middle of it. However OBV and RSI have bullish divergence, so perhaps form a short term double bottom here and bounce up to the first red resistance line, which matches the bottom of the ichi cloud. Putting in a tight stop because it could be a far break below. Day ended exactly on my entry point of...
Price action of ATRO does not look promising. 1. First, from May to Aug timeframe, looked to be forming a bullish wedge candlestick pattern (though RSI did not show any buildup). This is drawn with the dotted black trendline, and ended with a harsh drop due to a earning report about 50% less than expected. 2. The solid black trendline down has formed a...
Price currently at SMA 200 support, but SMAs are overall putting downward pressure. Ichimoku cloud also above and turning downward. Entering short at previous support (just above current price), with a stop at the wicks. Putting target near Fib retracement and previous support line. ~3x PL risk ratio.
RSI shows bearish divergence on the price peaks OBV show bearish divergence; in this last leg up the OBV has been declining. Price was starting to form a bearish wedge but fell out quickly, bounced from 100 SMA. Using Fib extension of 1.618 of an "ABC" pattern to project target, forming a double bottom from the most recent major correction. Duration of C...
AERI has had a bad year. From $50 down to under $18. However price is slowing down from its descent and recently formed a double bottom. And while price has been decreasing and stabilizing, RSI is moving up. Same for Accum/Dist, looks like moving out of the selling phase and into buying. So may be opportunity for a bounce here. It's already at the double bottom,...
X has had a long movement down, analyst targets downgraded, labeled as a strong sell, shorts picking up, etc. However RSI is showing bullish divergence. Going to take a shot at a contrarian trade here. Going to put the target at the convergence of Top of Ichi cloud SMA100 projection Fib Level Which is around $13. This one has a wide-ish stop in case...


