The double top rejection mentioned in the last post. We can see that price topped out at 0.90 and is now retesting the breakout from the last swing low.
Price action has continued selling off after retesting the previous breakout below the neckline and will be looking to hit another 500pips+ When looking at local price action on lower timeframes the double top rejection at ~0.90 has entered a distribution phase which is signaling price to fall further with the first target at 0.88 and so on. For price to hit the...
Since the last update we were able to perform about two to three swing trades. One from $70 - $79, and from $79 to $68. The next move I'm looking for is another short position from current market price ~($62) to swing to the next major low $33. We saw a rejection last week and we're currently pulling back to retest the little selloff we had. Could say this next...
Similar to USDCHF price broke below a major range and is now pulling back towards the latest breakout zone. Bulls are looking strong after securing the lower support level and we could see about 150pips as price action looks for targets around 0.61000.
Since the last post USDCHF sold off towards the demand zone and broke below support. Price is now pulling back towards the mid channel of the range where bulls will be tested again. For now price looks bullish but could see another selloff later down the road.
Price is set to head towards $50. Would like to see a pullback near bullish volume just after we push a little higher.
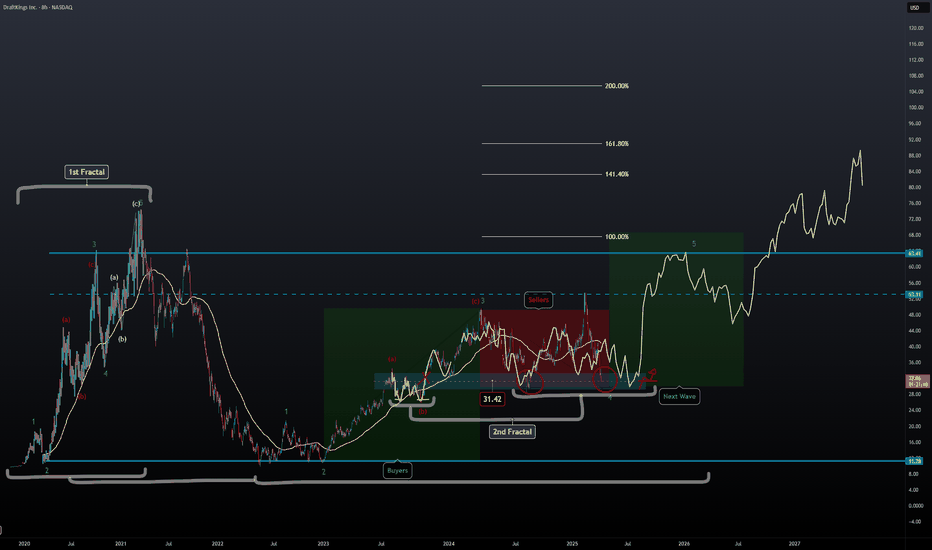
Price action looks very similar to the '23 Q3 play where we saw a double bottom move taking off from $26 - $49 which is also the ABC move that carried the 3rd impulse wave of the original fractal. We're still in correction wave 4 and are about to start wave 5 shortly from now to July. It's possible we could see price action higher than $74 based on the new...
Similar consolidation at this lower swing like the last time. Looking forward to seeing a break above liquidity and for price to return to the swing high once the markets are ready to roll. Sometime from now to July.
We're looking at 3 complete fractals and the fourth one being the current one. Same phase as the last, a bit of sideways trading/consolidation then aggressive buying breaking out to the upside. Price action has been trending upwards with HHs and HLs and we're currently at a Lower High bouncing off the lower trendline below. Would be ideal to look for long...
Would like to see some type of pullback as we're at a major resistance level and then a resumption towards the $6 target. This is the best fractal I've seen play out and is still on track.
One of the best fractal overlays I've seen with some Elliott Waves to go with it. Price is still in a uptrend but with growing sellers It'll come to an end similar to the last fractal. During the 3rd wave in the last pattern price experienced its first pullback at (B), and its second at correction wave 4 and the third after the last wave before we witnessed the...
Similar accumulation pattern to what we've seen last year December. Price action is holding up nicely above the 150d SMA on a daily TF with bullish closes also sitting above the 8d SMA. Volume is looking very good too with price sitting above the value area. I'm using the fibonacci extension to get a local target of $5.
Price is awaiting a movement towards $18,000 and currently in a distribution phase.
This TA focuses on long term projections using the last fractal pattern and a fibonacci extension to help with finding targets.
Strong uptrend and a similar fractal pattern like the last setup. Price is at the 5th wave and 3rd secondary wave.
Like mentioned in my last copper post price has been holding up very well and is heading to $6. Similar ABC fractal pattern to what we saw in '08 is still valid for this current price structure as well.
Similar to my last gold post we're tracking price using another method, parallel channels and Elliott Impulse Wave. Price finished correction wave 4 and is now on impulse wave 5 that will take us to $3k+ I'm interested in long positions only working with a 30d - MA. This will help with entries and further price movement on the way up.
Long term view on silver is still looking bullish and we can see plays towards $40 after hitting the $36 target based on my latest post with the successful iHnS pattern.


