Nedlog02
News today made all CAD pairs take off so need to be careful before jumping into completed patterns. Should regardless. Like always, waiting on price action to show reversal candlesticks and momentum to start coming down. If so, should get a nice shorting opportunity here.
Indicators look. Momentum breaking down and coming out of over sold area on RSI. Should be an easy trade. TP1 38% of AD leg. TP2 61.8% of AD
Just broke past the first PRZ zone with ease. Should go down to the AXA 1.27% extension and bounce! Also showing a crab pattern on the 1 hour chart.
End of the leg hopefully! Already in the zone. Price is between 88% retracement of XA and the 127 extension of ABA. Should see our bounce! TP 1 = 38% retracment of CD TP 2 = 61% retracement of CD Stop below 127 extension of AXA incase it pushes down to 2nd zone. RSI way oversold so shouldn't..
Not complete but looks really good. Esp like that the 88.2 retracement of XA matches up perfectly to the quarterly point..
Im in long now till hits zone. Looks good so far..
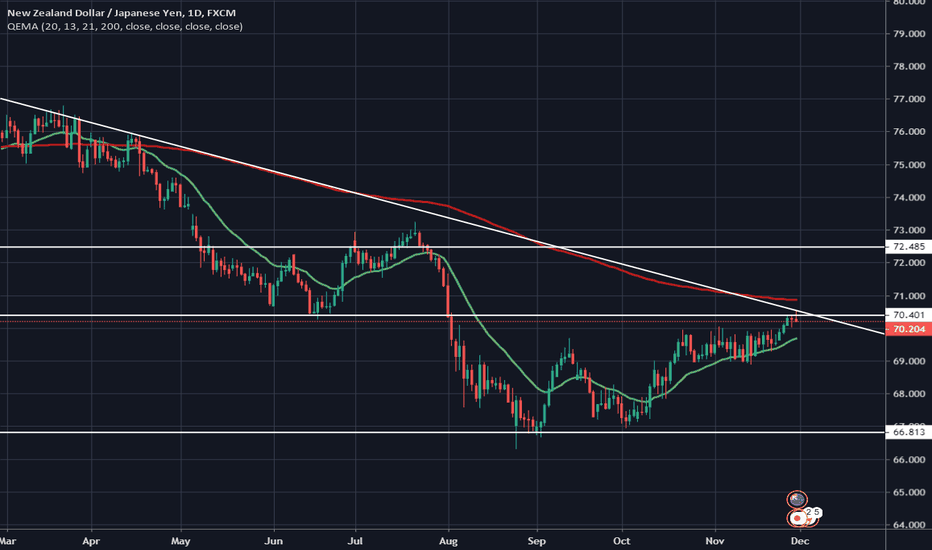
Picture perfect looking trade on the daily chart!! Price bouncing off of resistance, trendline, 200 ema. WOW. Also have nice candlesticks formation. Should be able to pick up an easy 100 pips!!
Nice channel here with a divergence on the stoch showing strength in the up trend. Should be able to get an easy 50-75 pips off the bounce.
Possible breakout! Just had a break and retest of support on the smaller time frames. Look to put a tight stop little above support now resistance in case of false breakout but should be able to ride this bad boy down!!
Absolutely beautiful set up. Price coming into a MAJOR confluence area. Price converging at trendline, 200 EMA, strong resistance level. Shooting star forming on daily chart. To top it off, stoch showing momentum max level. What goes up must come down!!


