NimbusTrader
QQQ is still within the Symmetric Triangle form. If the price continue to go higher and break the triangle, market may go higher. Unfortunately, it seems like it going to take few more days to form a breakout from the Triangle. At the meanwhile we can look at the support on 20EMA, let's see what happen on tonight forming. If the candle go below it, probably we...
#GE Looking at GE's chart, we will often see a recurring pattern that the price is unable to break through the 50MA resistance.. For the past few times, every time it fails to break through the 50MA, traders will be taking a short position. And usually it provides a great risk vs reward ratio.. However the key point here is what is floor price of GE (ie. the...
Last Friday we had another retracement and SPX close is now near the 20MA and also sitting right at the trendline. Today's closing will be an important point to watch and if it breaks down from the trendline, traders will be shorting it until the 200MA support probably Do follow us at our Telegram channel: t.me
FLOW seems to be bouncing off nicely from the trendline and this has been tested for a couple of times. Do you notice the deep V pattern at the chart? The price goes almost 90 degrees down way to hit the support line and fly from there. Do becareful if the price breaks the #trendline, so we shall place a buy limit that higher than the current candle to catch...
DJI had a slight pullback yesterday but is still above the 50MA so we are still optimistic to see a short term bull run We would suggest to avoid going into positions as earning season can be quite volatile The market will have big swings depending on the earning results of the major companies Do follow us at our Telegram channel: t.me
Alibaba is still moving within the downward channel and it's hitting the 50MA right now. Earnings are coming up in about 2 weeks, should be around the top of the channel if nothing major happens to the market Will be putting this in my watch list Do follow us at our Telegram channel: t.me
Charted this awhile ago while the Inverse Head pattern was forming near the bottom.. Today it rose nicely to the resistance of the Inverse Head pattern and will look to see if a right shoulder will be formed or will there be a break out from the resistance Do follow us at our Telegram channel: t.me
SPX formed a doji candle yesterday but still looking healthy at the moment. There might be resistance ahead from the larger down trendline. This will be an important area to take note. Hopefully the earnings season would help to lift the whole market higher Do follow us at our Telegram channel: t.me
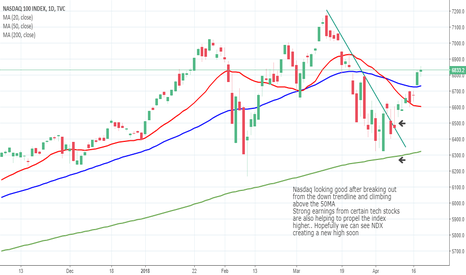
Nasdaq looking good after breaking out from the down trendline and climbing above the 50MA Strong earnings from certain tech stocks are also helping to propel the index higher.. Hopefully we can see NDX creating a new high soon Do visit us at our Telegram channel: t.me
Ethereum had a nice break out of the down trendline following the mega pump from BTC and it is now slowly drifting higher It would be good if we can go above the 50MA. We are currently short term bullish bias for ETH and perhaps this will get the ball rolling for ICO's bull run Follow us at our Telegram channel: t.me
SPX had a strong gap up for the opening and a decisive close above the 50MA. We are definitely short term bullish now and will look for setups to enter Guess the market is bullish after Netflix reported good earnings. Let's see if the upwards momentum is sustainable
The market was pretty bullish yesterday and google had a strong gap up after breaking out from an ascending triangle Looks good for a short term play
Daily charting of SPX on 17th April.. we can see that it is still trying to break through the MA50 resistance but so far it's still quite healthy as long as it stays above the trendline Also earning seasons are coming up and Netflix seems to be leading the good news. Good chance we will see a bull run if the earnings are all pretty good
NZDCAD at the H4 timeframe might provide a decent shorting opportunity as it broke out from a descending triangle.. Monitor for opportunites..
Apple is showing some sort of Ascending Triangle yesterday in the hourly chart.. Looks ripe for a short term breakout play
Short update on Dow Jones Industrial Index for 16th April


