Novi_Fibonacci
ModFX:GBPUSD has formed a Head & Shoulders Pattern! Price has already broken down below the "Neckline" to Confirm that Pattern. Currently, Price is working its way back up to retest the Breakout and if the level is strong enough and holds, we could see Price follow through with its reversal to lower prices! If the retest is successful, the May 12th Lows of...
OANDA:USDCHF has not only formed a Double Bottom Pattern but also may be generating a potential Elliot Impulse Wave! Bulls are giving the April & June Lows of .8038 - .8088, another go for a second time today after surpassing the first attempted High created July 17th to break above the level. So far Price today has broken above July 17th Highs and if Bulls are...
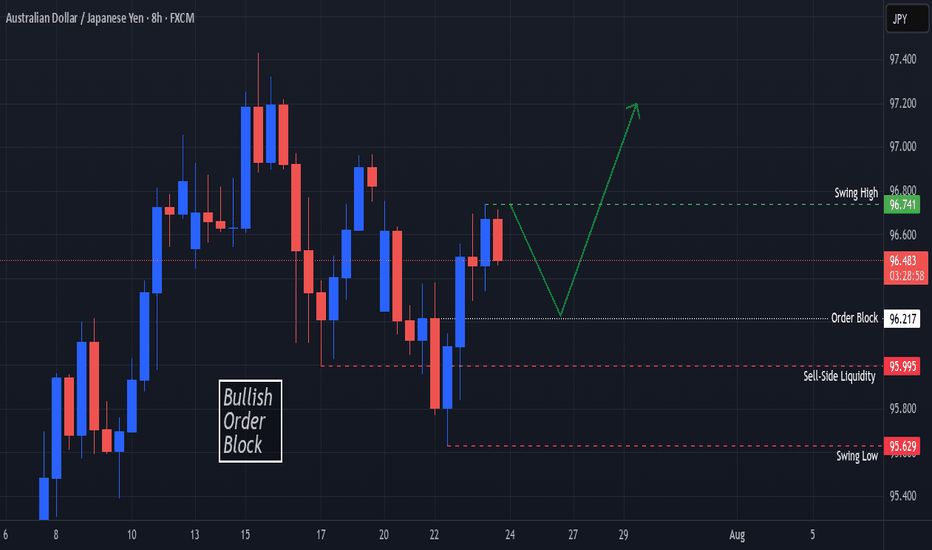
OANDA:AUDJPY Price finds Support at the Swing Low @ 95.629 and creates a Swing High @ 96.741! Based on the ICT Method, the Swing Low broke Sell-Side Liquidity @ 95.995 and opened up a Bullish Order Block Opportunity @ 96.217! Price is currently working down from 96.49 at the time of publishing but once Price visits the Order Block, this could deliver Long...
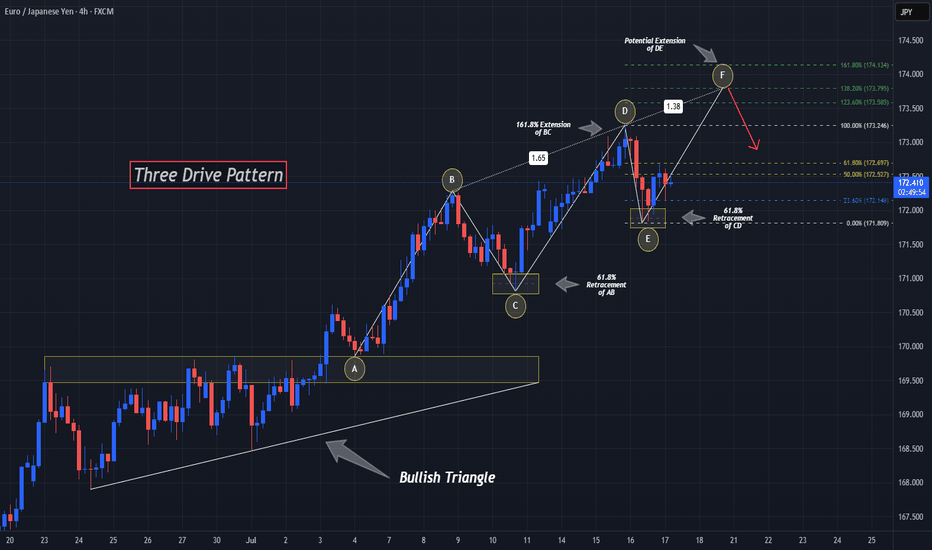
OANDA:EURJPY has potentially been forming quite a rare Reversal Pattern, the Three Drives Pattern, after making a Bullish Breakout of the Triangle, lets break it down! Three Drive Patterns are very similar to ABCD patterns except for one thing, a Retracement instead of a Reversal after the CD Leg is finished! In the CD Leg, Price creates quite a Trading Volume...
OANDA:USDCHF has given us a Breakout of the Expanding Range it has been traveling in since the Low @ .78712 created on July 1st. Now Price has already Retested the Breakout of the Rising Support of the Expansion and a Past Support Level, now turned Resistance @ .7960! Hourly candles are continuing to close Lower signaling further potential to the...
OANDA:AUDJPY is beginning to form a very convincingly strong Reversal Pattern, the Head & Shoulders! Starting with the Daily Chart we can see that Price is Forming a Doji Candle just after trying to Breakout of a Major Resistance Zone created from the Highs of March 18th and if Price is unable to close above this level, this strengthens the Bearish and Reversal...
OANDA:EURGBP has made some impressive moves up since the Low from May 29th and Price just fell short of the Highs of April 11th before falling into a very familiar Bullish Pattern, the Falling Wedge! The Falling Wedge is typically a Bullish Pattern where we expect Price to give us a Bullish Break of the Falling Resistance and Successful Retest of the Break...
Price on TVC:DXY after having broken below the Swing Low on June 12th @ 97.602 has created a lot of Indecision! Starting with a 5 Day Long Consolidation period as a Rectangle Pattern Then after the Bearish Breakout on June 30th due to the Federal Reserve mentioning possibly leaning towards Interest Rate Cuts, we see the TVC:DXY form a Expanding Range Now...
OANDA:EURJPY has formed a Triangle Pattern with a Rising Support and Resistance Zone @ 169.5 - 169.7 area. After the False Breakout last week on Friday, we see Price falls back within the Pattern and finds strong Resistance from the zone. Now based from the High - to Low - to Lower High where price made a 50% - 61.8% Retracement, we can plot the Trend Based-Fib...
The TVC:DXY seems to be forming a Cup and Handle Pattern on the 1Hr Chart! Cup and Handle pattern is considered a strong Reversal Pattern where we should expect Bullishness for the USD. After the 2nd or Equal High to the 1st was formed, Price made a Retracement to the 38.2% Fibonacci level and found Support to the begin forming the "Handle" or Consolidation...
Here I have a Multi-Timeframe analysis on OANDA:AUDJPY which is giving multiple signs of Higher Prices potentially to come!! First on the Daily we can see that Price formed a Hammer Candle after testing the March 11th Support Zone and as the next Daily candle forms (Today), we are already seeing a Bullish Confirmation candle begin! *Bullish Engulfing would be a...
OANDA:USDCAD Bulls were able to find support at the Sept. 2024 Highs after having traveled down a Falling Support for the past 2 months! Now we see Bulls pushing price higher creating a Rising Support with 2 tests having been successful and currently coming down for a 3rd test! Now Price has already broken a Previous Level of Structure which was a Past...
OANDA:AUDJPY seems to have started a Elliot Correction Wave after the Impulsive Elliot Wave came to a finish once Wave 5 ended this morning @ 93.774. Now after an Impulsive Wave ends, its theory that a Correction comes next and with Price having Retraced to the Golden Ratio creating a Lower High, this is the beginning signs of that theory in the works! The...
OANDA:USDCAD has been supported by a Falling Support Trend line since August 14th and here soon Price could potentially give us a Bearish Break to that Trend line! Once a Breakout is validated, we could look for a Retest Set-Up for some Short Opportunities to take Price down to the Support Zone created by the August and September 2024 Lows. An interesting fact...
FX:GBPUSD has formed a Bull Flag and we could be getting ready to see the Bulls take the spotlight! After Price broke through the Previous Level of Structure, Price retraces the High of 1.35589 to the 50% Fibonacci Level @ 1.35022 and is supported pushing Price back up from the Previous Level of Structure. -The 50% retracement signals the end of the...
This Educational Idea consists of: - What a Bearish Breakaway Candlestick Pattern is - How its Formed - Added Confirmations The example comes to us from EURGBP over the evening hours! Since I was late to turn it into a Trade Idea, perfect opportunity for a Learning Curve! Hope you enjoy and find value!
OANDA:GBPJPY struggles to reach Higher Prices then that of the High created on March 27th and leads me to believe we could see a Double Top Pattern in the making! Confirmation of the Pattern will come when: 1) Price declines back to 191.877 & 2) Makes a Breakout of the Confirmation Once the Pattern is Confirmed and Breakout is Validated: - This should deliver...
OANDA:EURJPY has began to potentially form a very strong Triple Reversal Pattern, The Head and Shoulders @ the Resistance Level lasted visited May 14th. I say "potentially" because the "Right Shoulder" or recent Lower High has been created but we still wait for the final decline to the "Neckline" or Support Area formed by the Lows separating the "Head" from the...


