OfficialTradeTalk
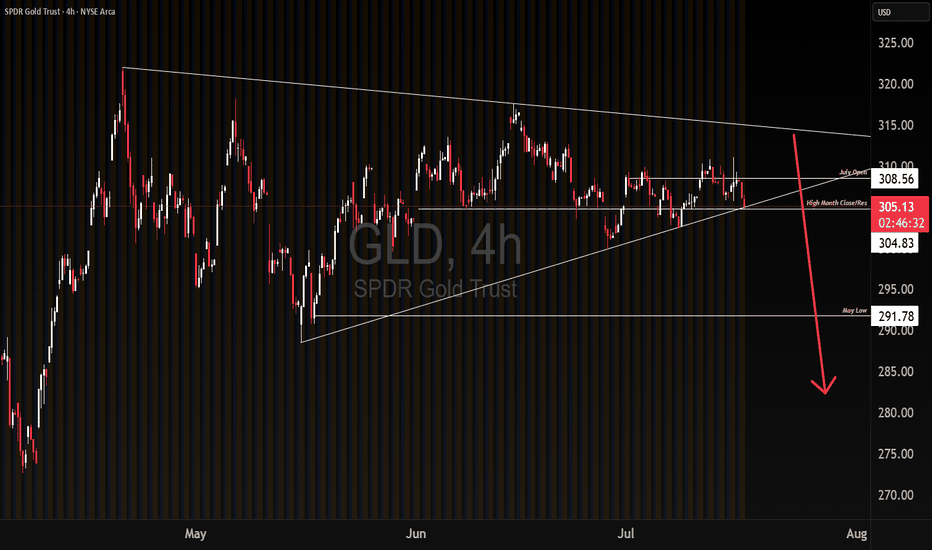
PremiumWe could be experiencing a break down on GLD based on capital outflows, going into riskier markets. If this larger time frame range break down holds, and we get continuation lower on downside momentum, we get a measured move target of May's low. Will be watching to see if the breakdown is a bear trap first. If it is not a bear trap, I will buy OTM Jan 26 puts....
Since the 90's we have seen many times where the broader market (SPX) has seen a pretty significant pull back, more than 10% and then a rally. Almost every time the market rose more than 20% in 60 days or less has been a good place to take profits. Clearly everything is super bullish right now, and I am not saying this will be the top, I am simply saying, we could...
I put this chart together for the Trade Talk community to see just how important yearly opening ranges are, and how much importance they carry through out the year. It is one of the simple ways for pro traders to technically identify trend, and how to stay on the right side of the trend for the entire year. View it on the daily time frame, and use it to see how...
Since the 2020 March sell off this trend line has not seen a weekly close below it, will it hold?
matic short I took yesterday
Matic short I took yesterday
We got the breakout of the Oh so important resistance level of 59638.5. So I would be watching that level for a possible retest and hold of support. For possible entries aiming of course for the all time high of 61900.0
So the King, AKA . . . #BITCOIN is fighting with resistance. I do have support below it just a bit, remember we let price tell us what is support and resistance, but we have a small idea as to where that may happen.
AUDCHF is coming into daily, weekly and monthly resistance. Today is the end of month as well as 1st quarter 2021. This has been bullish for 4 straight quarters. Is it going to stall out today. Are we in for a correction?
So I just want to see what the next 3 days of the dxy have in store, as we are above a very interesting technical level for now, however I know I'm not alone in watching the next 3 days, Didn't Russell Crowe play in that movie?
The trade was a buy. This morning after the intraday range stops were smoked both shorts and early longs. But as long as it closes the current 4 hour candle above 1.19637 I think its still valid to take out target. Entry was 1.19337 stop was 1.19333. Already took 2/3 profits off the table, expecting target 2 to be hit. Where at that point reload sellers will be...
Is EURUSD bullish? If EURUSD is bullish, which it kind of looks bullish, then this maybe a buying opp. We shall see
if you caught yesterdays live stream you know we were watching that level
So I like this as a swing trade as well, coming into the NY session gave a perfect entry for an intraday scalp as well. targets were already hit for thaty trade, but the swing trade is still underway.
The 26.39 is a weekly market structure area, and seems to be holding. If we get a pull back in the dxy would help silver to trade away from this area.


