PINE_LABS
Premium📌 Introduction: In the world of trading, correctly interpreting price movements is essential for making informed decisions. Technical indicators are key tools that help analyze trends, momentum, volume, volatility, and other aspects of market behavior. This guide explores a wide range of indicators—from traditional ones to those that combine advanced...
"We have identified a pattern 📊 that we’ve been studying for some time. Currently, we are observing a 50-day range ⏳ marked on the chart. If the price breaks and confirms the high of the last 100 periods, there is a strong probability of reaching the target zone 🎯, highlighted by the green rectangle at the top. It’s important to note that this projection is only...
What is Leverage? Leverage is like a "financial superpower": it allows you to control large amounts of money with just a fraction of your capital. But beware! This power comes with enormous risks. 📊 Visual Example: Your Capital Leverage Total Position _____________________________________ $1,000 10:1 ...
DECALOGUE 1: THE ART OF A GOOD TRADE (TECHNICAL) 🎨📈 1️⃣ Have a clear plan: Define entry, exit, stop loss, and take profit before you trade. ✍️📊 2️⃣ Cut losses quickly: Don’t let a bad trade ruin your capital. 🚫📉 3️⃣ Let profits run: Use trailing stops to maximize gains. 🏃♂️💰 4️⃣ Manage risk: Never risk more than 2% of your capital per trade. 🔒💵 5️⃣ Diversify...
We consider a very important area for this week, it is the sixth time that the price has been defended in this area, it is important to keep an eye on this level. If the level is lost only in this weekly period and confirmed in h1, we will be ready to enter a short. The target will be the previous weekly minimum
Our **Next Session Fibonacci** indicator suggests that if we break the Zero level, the next stop could be **$78,106** within this session. Otherwise, expect a pullback to the **0.236 level at $74,133.20**, only for the current session. 📊
"Will we enter unknown territory if we reach a new ATH? Or will the selling pressure take control to bring the price back down before a significant impulse?"
"Breaking the previous week's low, we wait for confirmation with a retest and then enter a💀 SHORT POSITION,👇👇 only if the current candle closes below the previous weekly low.
Strong weekly support at $56,000-$54,927 has been respected on several occasions. This suggests accumulation of buyers in that area and the possibility of a bullish rebound. Recent candles indicate a double bottom and little selling pressure, reinforcing the idea of a potential rise towards $58,000 or higher. However, if the support is broken, the price could look...
The sell signal is triggered when the price falls below the lower bounds of both channels, indicating strong bearish pressure. Specifically: Channel 1 and Channel 2: These are based on a Simple Moving Average (SMA) with a range adjusted by a multiplier. These channels represent dynamic support zones. Breaking the lower bound: When the price breaks below the...
The sell signal has just been activated. We need to wait for this candle to close below the previous one. Specifically: The sell signal is triggered when the price falls below the lower bounds of both channels, indicating strong bearish pressure. Specifically: Channel 1 and Channel 2: These are based on a Simple Moving Average (SMA) with a range adjusted by a...
The Sell signal from our Algorithm has been triggered. Now, we just wait for the retest back to the Kernel divergence and confirmation, with a maximum of three candles. If the candle closes above the Kernel, the Short will not be executed. Once confirmed, we will enter the trade. We consider the Triple Bottom formed in this same candle to be very important, so a...
"If the Divergence of the 'Quadratic Kernel with Quadratic Divergence' breaks downwards, we will enter a Short position immediately. We will notify where to place the SL. For now, it has already made an attempt but was rejected.
If we manage to break the resistance in the 30 min timeframe and it is retested we will go Long
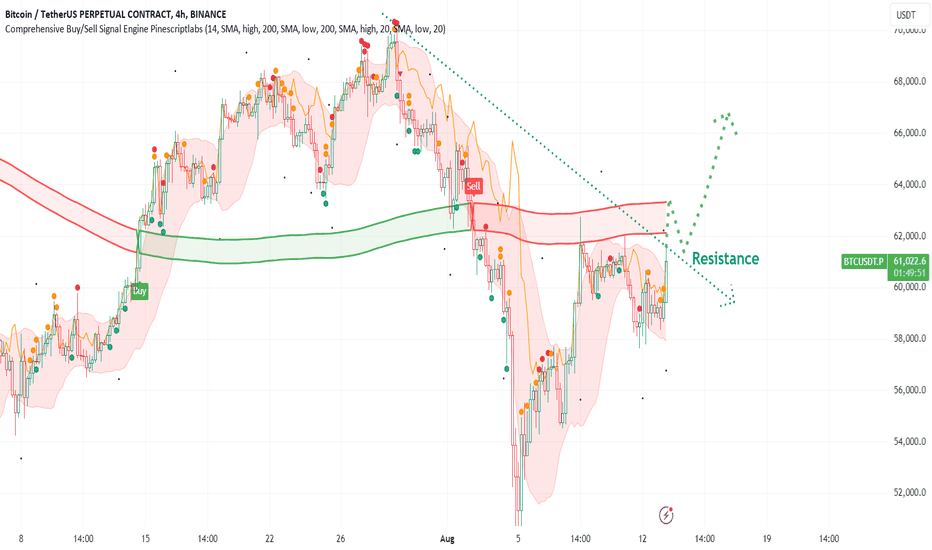
We observe resistance in this candle on the 30-minute, 15-minute, and 5-minute time frames. If we manage to close above it and retest within the range of $61,600 to $63,255, we could have a clear path back to $69,000. A pullback of at least 3-4% could be possible without raising alarms before continuing the upward movement from this point.
"Let's take advantage of the previous session's retracement"
We observe in multiple timeframes of the regression line the importance of this level, which, if broken to the downside, would lead to a free fall to the next zone.
We found a large support area, we expect a new retest and are considering a long entry."


