PIPsOptimizer
Market Overview: Bitcoin is trading at $84,185, showing a +1.63% increase. The price action suggests a potential breakout towards the upside. 🔹 Chart Structure: BTC has been consolidating in a range-bound structure after a sharp upward move. Previous rising wedge patterns led to corrections, but the price is holding key support levels. A breakout setup is...
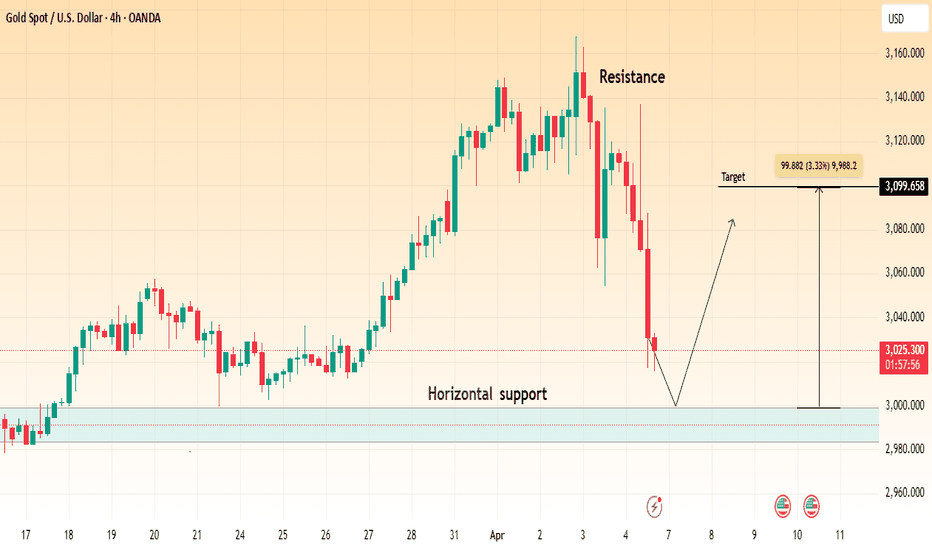
🔹 Market Structure: Gold is currently in a corrective phase after a strong bullish run, facing a pullback from recent highs around $3,160. The price has now approached a key horizontal support zone near $2,980 - $3,020. 🔹 Key Levels: ✅ Resistance: ~$3,160 (previous high) ✅ Horizontal Support: ~$2,980 - $3,020 (marked in blue) ✅ Target Level: ~$3,099 (potential...
📉 Market Structure: Gold was moving in an ascending channel, but price has now broken below the support trendline. This suggests a possible trend reversal or correction. 📌 Key Levels: Resistance : $3,125 - $3,170 Support: $3,054 - $3,035 Target: $3,000 - $2,995 📊 Trade Idea: A pullback to support-turned-resistance could give a short...
Ethereum (ETH/USD) Breakout from Falling Wedge – Bullish Momentum Ahead? This 4-hour Ethereum chart shows a breakout from a falling wedge pattern, a bullish reversal formation. The price has started forming higher lows, signaling potential upside movement. The projected target is around $2,411, indicating a significant recovery. A successful retest of the...
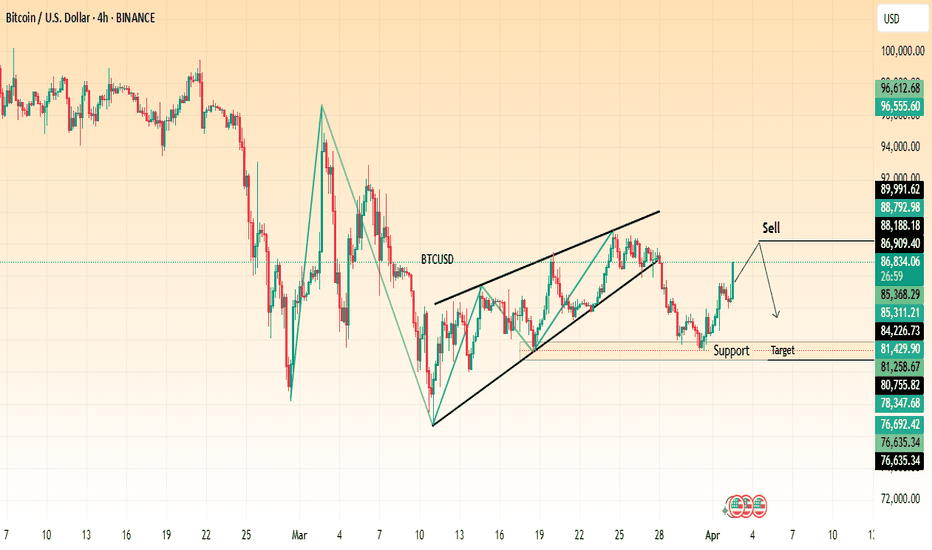
The chart suggests a potential bearish move after a rising wedge pattern breakdown. Key Observations: Rising Wedge Breakdown: BTC formed a rising wedge, which is a bearish reversal pattern. The price has broken down from this wedge, indicating a potential downtrend. Support and Resistance Levels: Resistance Zone: Around $88,188 – $88,792, marked as a key...
Key Observations: Current Price: Gold is trading at $3,127.450 at the time of the chart. Trend: The chart exhibits a strong uptrend, with higher highs and higher lows. Support Levels: Several support levels are marked in the $3,010 - $2,999 range, extending down to around $2,906. Resistance and Target: The immediate price range is highlighted, suggesting...
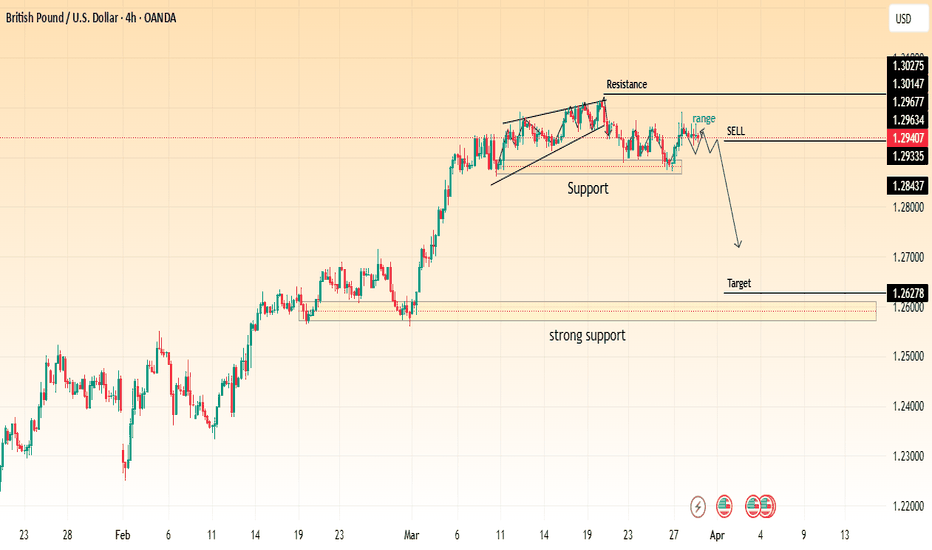
Key Observations: Rising Wedge Breakdown: The price initially formed a rising wedge near resistance. The wedge broke down, indicating bearish momentum. Support and Resistance Levels: Resistance Zone: Around 1.3014 – 1.3027, marking a strong rejection area. Support Zone: Around 1.2933 – 1.2843, where price previously bounced. Strong Support: Around 1.2627,...
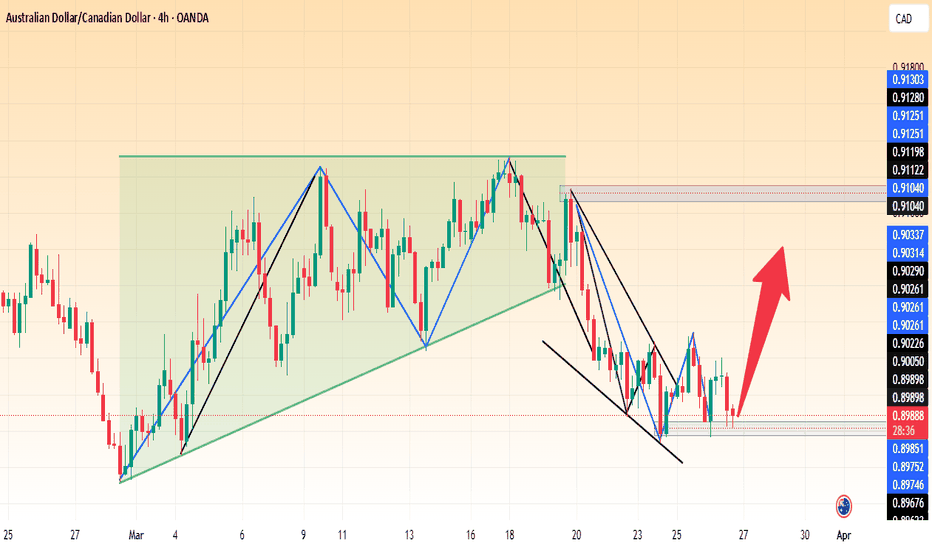
It illustrates a downward trend with a falling wedge pattern, which is a bullish reversal pattern. Key Observations: Falling Wedge Pattern: The price has been trading within a downward-sloping channel. The wedge pattern suggests a potential breakout to the upside. Breakout Opportunity: The price is currently near the lower boundary of the wedge, suggesting a...
Key Observations: Support Zone: A crucial support level is marked below the broken channel, indicating a potential area for a price reversal. Bullish Projection: A breakout above this support level could push BTC higher towards the target price of 94,101.24 USD. Technical Patterns: The price initially showed a strong downtrend, followed by a recovery forming an...
The price is in an uptrend, making higher highs and higher lows. A potential reversal zone is identified around $3,110, marked as a possible sell entry. The chart suggests that after reaching $3,110, the price may decline towards the support zone at $3,010 - $2,999. Confirmation of the sell trade can be considered if price action forms a bearish structure...
📊 Chart Analysis 1️⃣ Accumulation Zone : The price previously traded within a rectangular consolidation range before breaking down. 2️⃣ Bullish Reversal Pattern : A falling wedge has formed, indicating a possible breakout to the upside. 3️⃣ Key Support : The price has tested the 0.8980 - 0.8970 zone multiple times and is showing signs of rejection. 4️⃣ ...
📉 Market Structure & Pattern: The chart shows a broadening wedge pattern followed by a rising wedge formation. Price has reached the upper boundary of the descending channel, where a potential sell-off could begin. 📉 Bearish Outlook: The sell signal is indicated near 2,811 EUR, suggesting a possible reversal. The target area is around 2,769 - 2,700 EUR,...
📉 Pattern & Market Structure: The chart shows an ascending channel that was previously supporting price action. However, the price has broken below the lower trendline, confirming a bearish breakdown. The recent price action suggests a shift from bullish momentum to bearish sentiment. 📉 Price Action & Target: A breakdown from the channel suggests further...
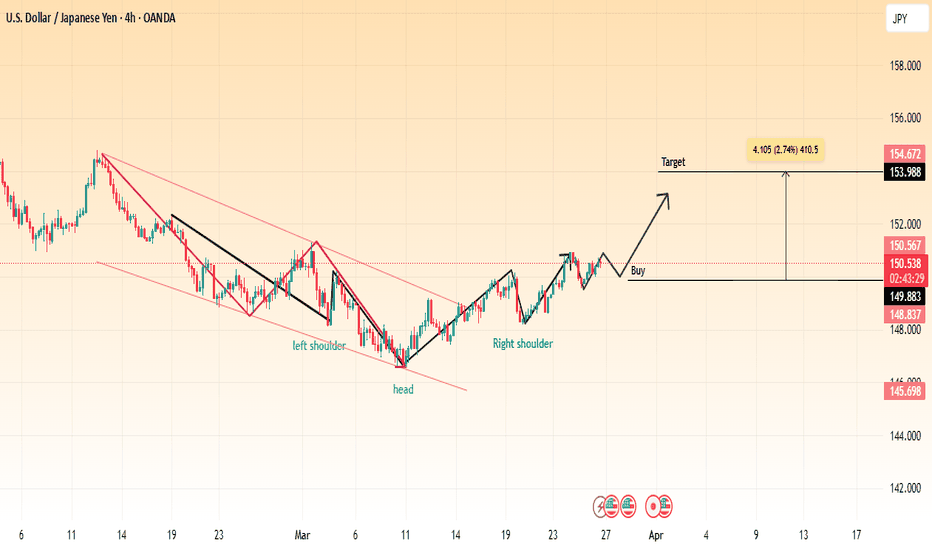
📌 Pattern: Inverse Head & Shoulders 📌 Analysis: The chart showcases an inverse head and shoulders pattern, a classic bullish reversal formation. The price has successfully broken out of the downward trendline, indicating potential upside movement. 🔹 Left Shoulder: Formed during the previous retracement. 🔹 Head: The lowest point of the pattern, marking strong...
This 4-hour chart of GBP/USD shows a clear bearish setup: 🔹 Rising Wedge Breakdown – The pair has broken below a rising wedge pattern, signaling potential downside pressure. 🔹 Support and Resistance Levels – Resistance at 1.29206 - 1.30275 Support at 1.28000 - 1.28437 Strong support at 1.27539 🔹 Sell Confirmation – A sell signal is indicated, suggesting...
Market Structure & Analysis: Falling Wedge Breakout: Ethereum previously broke out of a falling wedge pattern, which is a bullish reversal signal. Ascending Triangle Formation: Price is currently forming an ascending triangle, indicating potential for a breakout. Support Levels: $2,021 – Local support. $1,926 - $1,873 – Strong demand zone. Resistance...
Market Structure & Analysis: Rising Wedge Formation: Price has been moving within a rising wedge pattern, which is typically a bearish reversal pattern. Bearish Breakdown Expected: BTC is testing the lower boundary of the wedge, indicating a potential breakdown. Resistance Zone: $89,649 – Key resistance level preventing further upside. $88,336 – Local...
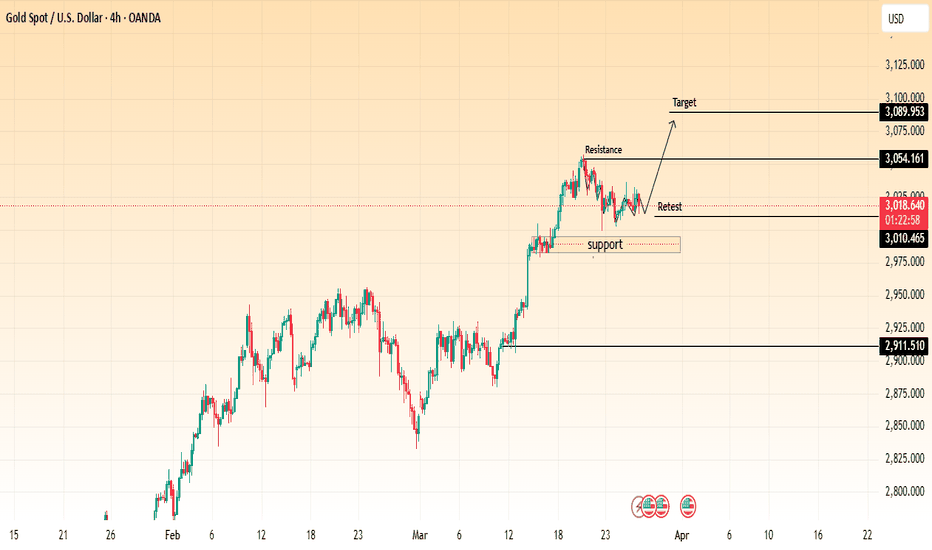
Market Structure & Analysis: Uptrend Confirmation: Price has been in a strong bullish trend, forming higher highs and higher lows. Resistance & Retest: The price recently hit a resistance zone around $3,054 and pulled back for a retest. Support Zone: A key support level is marked at $3,010, which has held multiple times. Bullish Retest Setup: If the price...


