PW
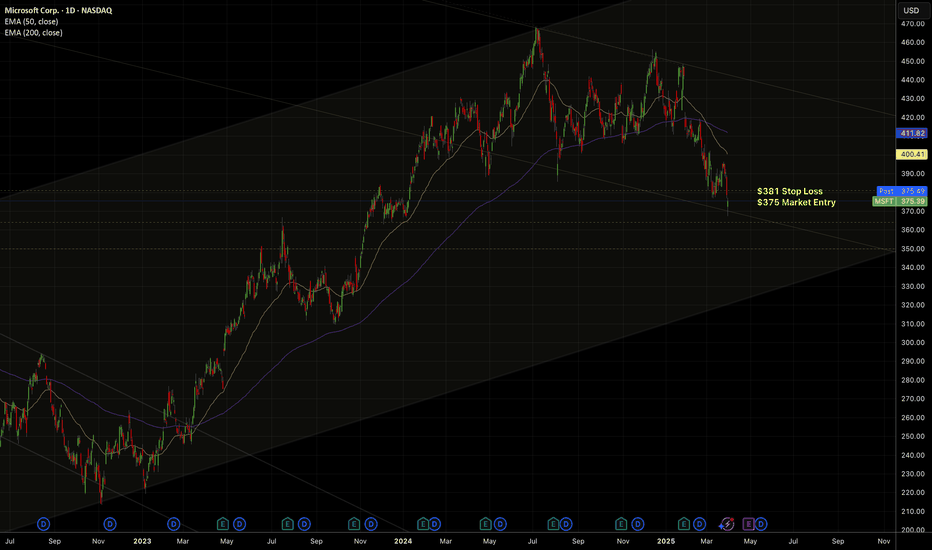
🔻 **Trade Idea: SHORT MSFT** I'm shorting Microsoft after a confirmed **death cross** on the daily chart (50 EMA crossed below 200 EMA), signaling long-term weakness. ### 📉 Structure: - Breakdown of support at $384 - Clean retest + rejection at $377 - Lower highs and lower lows in play - Volume spike on breakdown confirms seller strength ### 🎯 Trade Plan: -...
This is an update of this prediction which proved to be correct: The similarities with April continue. See April details below
Lows for this 3 month downtrend are probably in, but we rebounded too quickly. For now we appear to be respecting the old channel.
We've reached the lows per this chart I published Eventually we must move up again, it seems like it's time.
Original trade posted here: Short progressing well, expecting Monday to offer another nice move to the downside. There may be a bounce in the support zone $233-$227 at which I may close 1/2 of my short.
Support at $250, $245 but I suspect this won't hold. Tight stop on this. Target $220 for the time being. Updates to follow.
This is an update of last weeks trade posted here: I see support at $513, $450, $390. Yesterday I took some profits from my trade at $515 level on the expectation of a small bounce today. This also coincided with a bottom of a 15 minute channel (see below). Importantly, Apple has remained weak despite the market moving higher but recently SPY has been...
Some thoughts (caveat I am a novice) - Many similarities between the April crash and December crash are evident at this point. It has served well as a compass when navigating this downtrend. From a timing perspective, in April the correction took about about 3 months (87 days) to play out. Right now, we are nearing the 3 month mark since the December downtrend...
Short in the redzone and buy in the greenzone. It's relatively conservative, low maintenance and it's has been working well. Expecting to see 500-550 Stamp in the upcoming week.
(As a TA newbie, this is mainly a note to myself) Technical picture indicates a bearish channel. Also we appear to be following a course not dissimilar to the April crash pattern (see below). Fundamental picture seems to weigh in favour of the bears 1. Reputational damage following BitInstant arrest 2. Uncertainty over status of MTGox exchange 3. Uncertainty...
This is a very simple trading strategy: go / long short BitFinex when the 2HR EMA crosses. Note: In this chart entry price is the candle after the EMA cross. This is because the EMA's will often look like they are crossing but don't end up doing so. Of course this does not maximise potential returns however as this chart shows, sticking to this strategy would...
(As a TA newbie, this is mainly a post for myself) The triangle has been well documented across TradingView already, however there was a lot of difference of opinion what the most important trendlines were. Stamp / Houbi has been leading Gox during this phase - meaning we should give more weight to Stamp than we historically would have. Not going to try and...
I've been surprised to see how well these channels have fit. We are at a crossroads now and may enter a new daily channel..or bounce. If it is the new channel and we sell off hard the channel should help us determine the entry / exit points. Crossoads is supported by LeMogs bearish triangle formation on a smaller timeframe
Possible outcome: A retrace to the major downtrend line (drawn from ATH double top to recent triple top) would mean a 850-860 target on Stamp in 12hrs. I think it is very unlikely we will go higher than $860 and I will be shorting at this level. Disclosure: I've been long since we broke out of the down-channel.
Given the overall downtrend, this would appear to be consolidation before going lower in the form of a bearish pennant. blog.nobletrading.com


