When analyzing the NQ weekly chart, we observe that the price has consumed internal liquidity in the premium region of the range and closed in a way that favors the continuation of the bearish movement. Given this, we believe the next **Draw on Liquidity** will be the weekly double bottom located just below. However, since the market has experienced a sharp...
When analyzing the weekly DXY chart, we identify the presence of two CRTs: one bullish and one bearish. However, the bearish CRT has a low probability of success due to the candle formation and the fact that the price is still in a discounted region within the range. Given this, our initial expectation is for the price to drop at the beginning of the week to...
For BTC, we are still sticking to our "to the moon" analysis 🚀 hehehe. We remain in a trade with the following parameters: Entry: 81,758 Stop Loss: 79,901 Target: 109,390 This is our trade operation, but we have also increased our hold position at this entry point, aiming for the very long term. Currently, our average price is 42,350. What reinforces our...
For the DXY, we expect the week to remain bullish, driven by the ongoing correction after a significant price drop. Our expectation is that the upward movement will extend to the weekly key level premium. This bullish outlook is reinforced by several factors. First, we observed a bottom SMT with GU, followed by a market structure break on the daily chart....
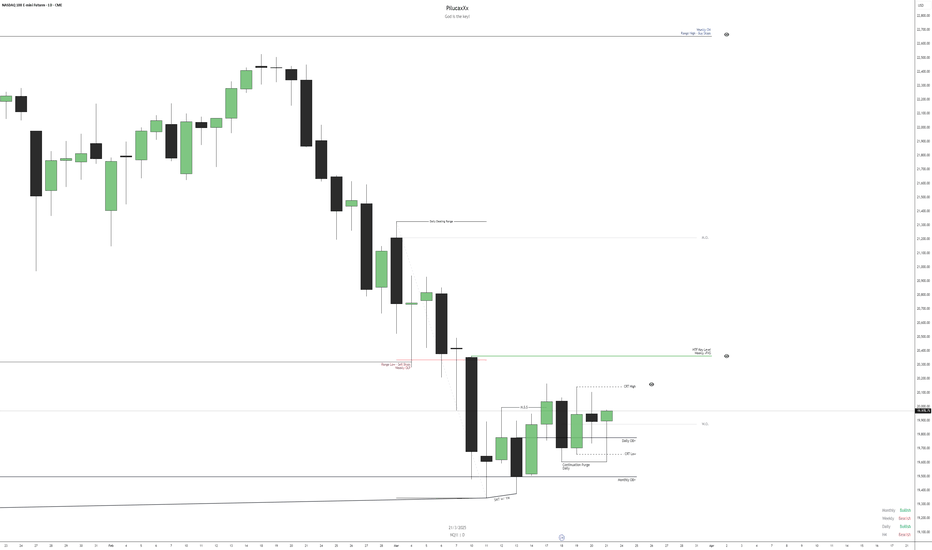
Analyzing the NQ for the upcoming week, we observe that the price held at the monthly OB, where an SMT also formed, reinforcing the indication of a bullish continuation from that point. On the daily chart, we identify a shift in market structure, evidenced by the presence of an SMT + MSS, followed by a continuation purge of the price. Given this, we understand...
When analyzing BTCUSD, I believe it has found its bottom. We have several confluences indicating a potential bullish move, including the mitigation of a monthly key level in a discounted region, an SMT swing low with ETH, and liquidity strategically positioned to act as fuel. Given this, I genuinely think the next stop is the moon. Let's go, BTC! 🚀
When analyzing gold, we observe a monthly chart with a bullish structure. However, the monthly candle left a low without an apparent wick, which may indicate a region to be liquidated in the future. On the weekly chart, the asset confirmed a break in structure, reinforcing the continuation of the bullish movement. On the daily timeframe, we identify a possible...
On the monthly chart, NQ maintains its bullish structure, confirming an uptrend. However, in recent weeks, the price has undergone a correction, pulling back to an equilibrium zone before potentially resuming its predominant upward movement. We can see that the price is holding at the Mean Threshold of a monthly rejection block, while also forming an SMT on swing...
For the DXY, on the monthly chart, we remain in a consolidation bias, as the price is trapped within a range formed by two FVGs. However, when analyzing the yearly candles, we notice a macro bearish bias, since the 2025 candle has swept the 2024 high and is now targeting the annual lows. Since we trade intraday, it is essential to analyze other timeframes to...
When analyzing the bonds, we identified an SMT between them at a PDA located in the monthly premium region, further reinforcing the possibility of a DXY rally and a drop in EURUSD, along with bond depreciation. However, to validate this scenario, we still need confirmations on the daily chart to ensure that the bias remains aligned with the market structure.
In my view, the DXY could have a bullish bias this week, but only as a correction after last week's sharp drop. The main bias is still bearish, as we are on the sell side of the curve. Therefore, long trades should be approached with caution since the price can reverse to the downside at any moment—after all, the market is sovereign, and only it determines its...
For the DXY, we have an initial outlook of seeking internal liquidity in the discounted region of the monthly range, further reinforcing our bearish trend. Additionally, the presence of a **bottom SMT** in bonds, within a **bullish PDA**, suggests an upward movement for them.
If the monthly close occurs as projected, we will confirm a double liquidity purge, signaling a bearish scenario. Additionally, buyer liquidity will have been absorbed, with the price closing within the range, further reinforcing the downside perspective for NAS100. However, we still have one more week to validate this bias. On the daily chart, we will wait for a...
Gold showed a **double purge** signal, which could indicate a **bearish correction** move. This correction aims to seek liquidity in a discounted region, allowing the continuation of the **bullish** movement afterward. It's important to note that the correction can be seen as an opportunity for accumulation before the trend resumes upward, with the market looking...
Given the current scenario, we maintain a bias toward the continuation of the DXY's decline, as it exhibits MMSM characteristics. Additionally, bonds have invalidated a bearish FVG on the daily timeframe after holding at a bullish PDA in discount. However, caution is essential, as we cannot ignore President Trump's statements, which are shaking the market and...
Today, my analysis of EUR/USD points to a potential bearish movement, based on the following points: First, the correction on the 1-hour chart suggests that the pair is seeking liquidity outside the daily range. The daily IRL region coincides with a 4-hour OB (Order Block) and a swing high, which could create an order cluster. The expectation is that the price...


