Poopieman
Look at that RSI boysssss! And look at those trendlines?! It currently is hovering at the lowest trendline available. I am expecting a bounce towards 1600+ in a 1-3 months period. Buy Gulden, Wait*, Enjoy 3x or more (when it breaks out). *Set a stoploss at a place you find suitable
The most likely, longest possible time periode, absolute bottom , has nearly been found (between 500-520). If you want to buy bigger amounts, you can start slowly accumulating at the current level. Place a stoploss if you would like that, I will not. You can either open for long term (1-2 years) or try to get the 100% profit within approx 1-2 months. I have...
Hey guys! I have made a lot of analyses on NLGBTC which showed the upside potential, however, none of them came out to be right. But then again, I have also given a clear stoploss! If you would had followed my idea, you would hadlost 10%, but you will now be able to buy 30% more NLG! But wait... Should you buy now, or should you wait? In general, the entire...
Between 4th and 13th of August. Follow and drop a like if you want to see more lines. Also check out my previous analysis, which made you miss massive gains.
Title says it all. Also check my previous call
Risk takers could buy and put stoploss under green line. Otherwise I would wait to break the blue line first. RSI looks good if we have some more buying power. Please check out my other analyses and follow me if you like my ideas!
Chart shows it alllllllll
We broke the downtrend, this is what the start of a bullrun looks like. It's never getting sub6k anymore.
Still room to go down a bit, but a bounce could be any time now, most likely to $0,075 Also highly oversold coin
I have drawn two possible paths for Gulden to follow. One shows a bounce, if we close above 1000 sat. The other shows the way down to next support if the strong support on 1000 sat is broken. Stay strong.
This is a follow-up on my previous analysis. I have added a new consolidation line which I did not see last time. Breaking through the lower blue consolidation line could lead to a rally towards the upper consolidation line. If you did not buy NLG yet, now is the time I personally would. Buyzone: Anything between 1000 and 1250sat. Targets: 1 - 0.00001390...
Im glad I found this coin back in 2016. In todays crowded cryptomarket it's easy to miss this one. That's why I am bringing some attention to the amazing potential of this coin. Chart information: The NLGBTC chart is totally different from all other cryptocurrencies, which all seem to enter a long-term bear market. Just compare it to any other altcoin. They all...
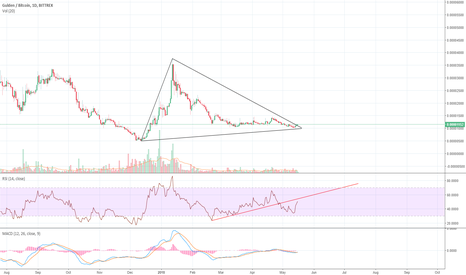
NLG broke out of triangle. MACD crossed, RSI above 50. If the RSI goes above the red line we can expect a long term bull run.
This update is to show the possible movement of NLGBTC in the upcoming days. Also, the major update has gone into the final testing phase (dev.gulden.com). My previous TA () still stands. RSI bullish divergence seems to hold, RSI recovering a bit as it was close to being overbought (Be aware of it crossing the bullish divergence line). Crazy times ahead with TA...
Can NLG break 1700sat and will we see a breakout to 2720? Note for everyone reading this: I have been educating myself on TA for just a few months now. This is not a buy/sell advice. I am looking forward to your opinions on NLG and my Idea.


![[NLG] Critical day(s)? NLGBTC: [NLG] Critical day(s)?](https://s3.tradingview.com/x/XyYoe6Dy_mid.png)
![[NLG] Huge opportunity now Gulden 2.0 has launched! <PoW²> NLGBTC: [NLG] Huge opportunity now Gulden 2.0 has launched! <PoW²>](https://s3.tradingview.com/n/NthIA6tI_mid.png)


