PoorMemory
Bearish pennant formed and sharp bearish divergence on the RSI, Elon personally receiving billions from the pockets of the company. This alludes to possible instability on the inside, despite being up a significant amount this year. Companies are like icebergs, cracks on the surface run deep, negative information is repressed. In my opinion, a drawdown of over...
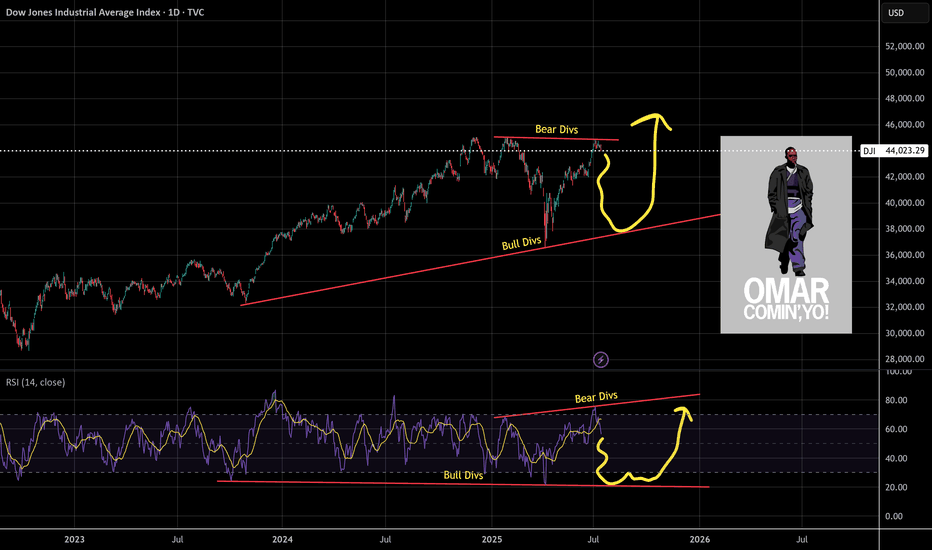
Unlike the SPX, the DJI didn't make a higher-high. Why is this? I think partially because it's price weighted as opposed to market cap weighted like the Nasdaq or SPX. The other part would be CPI numbers. So what's next for the DJI? I see hidden bullish divs long term and hidden bearish divs short term, this a common shake out tactic I see to liquidate longs and...
Target 1 is 5800, calculated from taking the height of the cup and handle structure divided by 2, added to the top of the handle inflection point.
Now that the cup and handle formation has been reached and the correction finished, I think we have 1 more leg up. It's also possible that we fall from here, but I think another fakeout upwards is likely as bearish divergence forms on the month, but isn't quite there yet (RSI needs 1 more higher high to confirm bearish divergence) Either way, my short targets...
Silver forming a C & H, entry around $32-33 hopefully there will be a pullback
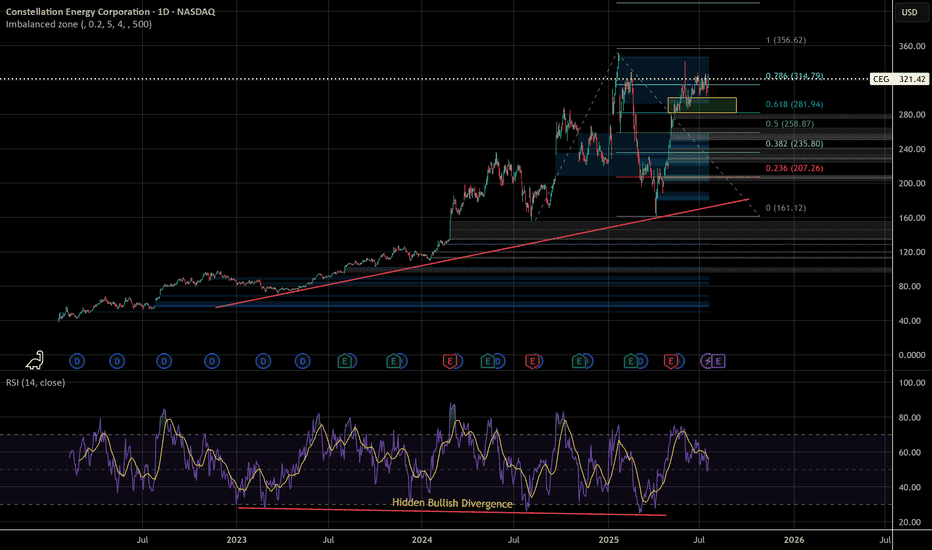
My buy zones are below, as we approach the 1.618 extension this insane wave looks like it may out of steam soon. As a best-guess approach I will wait for the 0.618 price or go look for another stock if that doesn't materialize
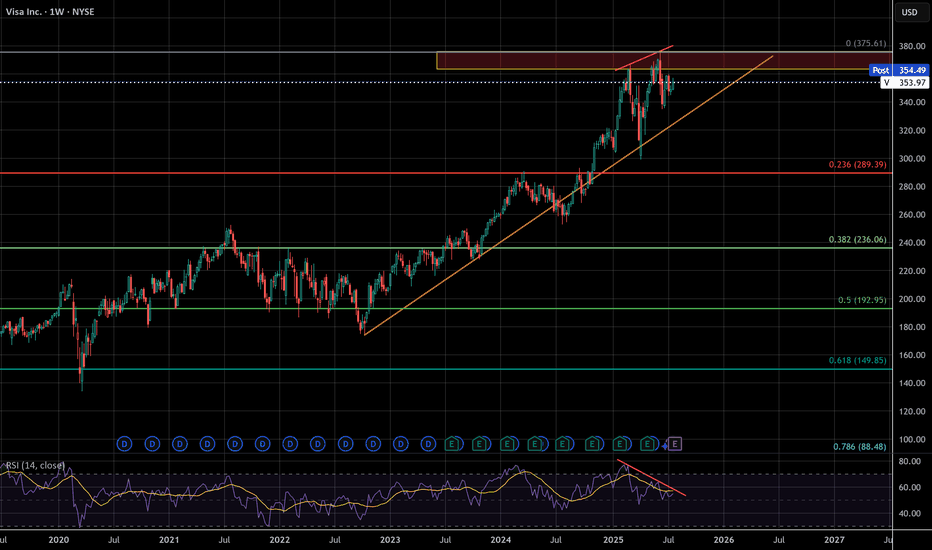
I've seen a lot of negative sentiment online lately about the impending bubble, but even with social media, crude AI, and the US dollar being the peak of that negativity this whale has been dying slowly and few have taken notice. VISA has begun to censor what can be bought, overcharge merchants, and short change banks on interchange fees. These are acts of...
URA continues to pump as nuclear energy speculation goes wild but be careful, if tech goes down it may just take down nuclear with it. Tariffs can also cause a massive price swing, my guess is that if Canada is tariffed the cost of URA will go through the roof
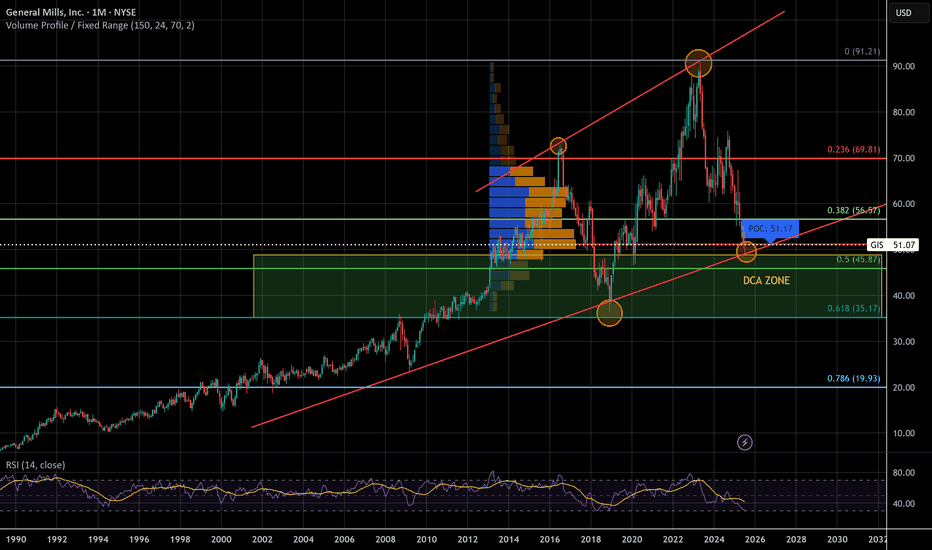
We could be witnessing the biggest correction in General Mills history, again! For the 2nd time in 5 years! I trust in the golden fib, volume looks good, and RSI is low. If it makes it to the top of the channel it'll double in price in the coming years. This looks like a good candidate for Elliott Waves but I'm no good with them. A lot of people think a recession...
Oklo is looking pretty decent, waiting for a break to confirm this momentum trade
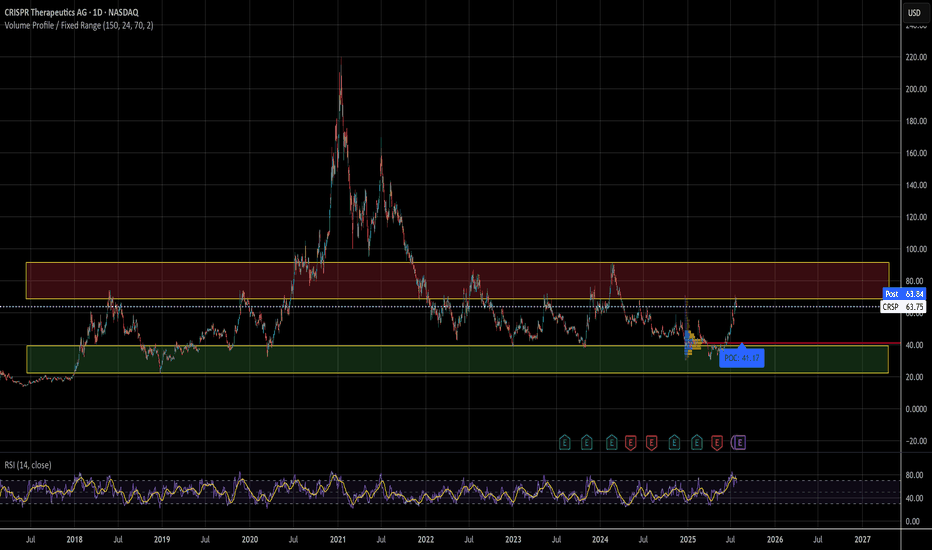
I've been trading the range for a while now, so when's it time to actually hold this obviously important technology stock? Maybe when the RSI doesn't look like garbage. Until then, THE ZONE!
Finally a new Starbucks competitor has arrived! Here's my possible DCA zone. I may have to settle for around $30, watching the RSI to see how it looks along the way
I see no bearish divergence, with hidden bullish divergence forming. Waiting for a dip below the current support for a buy, this looks great to me personally. This also fits in with the general narrative of nuclear power being on the rise, it's about time.
I think AMD needs to cool off before it continues further, possibly tapping $160 first before a serious correction. Targets are listed at the strong support ending at $120. RSI printing bearish divergence on multiple time frames Look at the red line, look at the direction of price. It's still a downtrend.
This Big Beautiful Chart or B.B.C.™ shows possible extensions for this wave, when extending into all time highs there's not a lot to go on, but the 1.618 fib extension is my go-to. Paired with RSI and trend channels you can start to get an idea of where resistance and pullbacks may be. RSI has bearish divergence so it appears we are losing investor confidence at...
Looks like it may be forming a cup and handle, bearish divergence on the RSI
Since I started in crypto, I've seen this play out dozens of times. If it's your first time, I suggest looking at Bitcoin or Ethereum to get a rough idea of what this cycle looks like and how to recognize it. I'm waiting for a blow off top, but I could just as easily be left in the dust. Time will tell, and my precious metals will keep me warm at night lol
As spending heats up considerably with the 5 Trillion USD bill, in my opinion it looks like CAD is set to skyrocket vs the USD once again. The main driving factors include greater industrialization (worlds biggest nuclear plant, more gold/platinum production than the USA, bigger oil reserves than USA), comparatively less spending, less tariffs, expanding to other...


