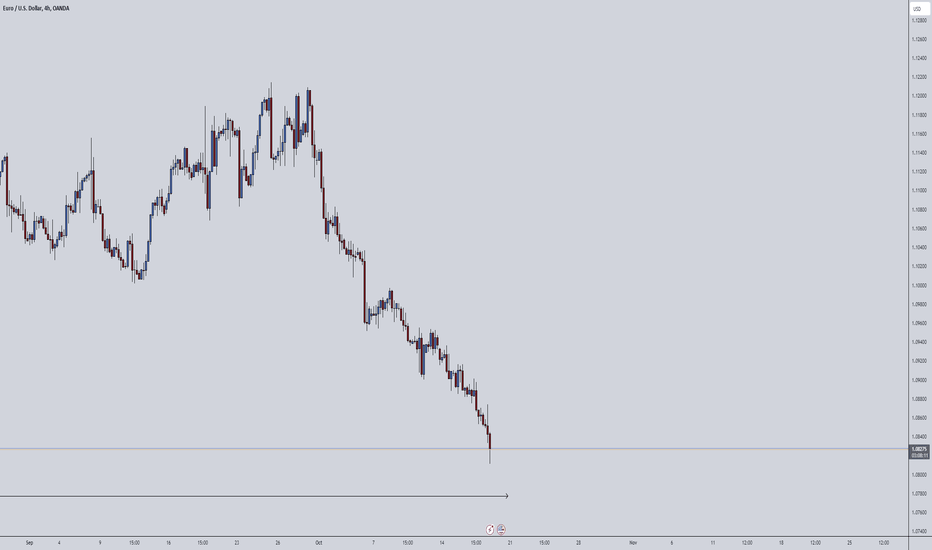
Current Market Analysis: - Monthly Trend: Bearish - Weekly Trend: Bearish - Daily Trend: Bullish - H4 Trend: Bullish Strategy: - Waiting for H4 trend shift to confirm a potential reversal - Anticipated Break: Daily support turning into resistance
Bitcoin formed a clear W pattern at a strong support zone, indicating a potential bullish reversal. This setup suggests strong buying momentum, with a take-profit target set at 111,598, aligning with the pattern's projected move.
DXY 99.418 Bearish Target – Summary: 99.418 is likely a key support level or technical target based on chart patterns or retracement levels. It marks a potential bounce zone or short-term bearish goal before deeper levels like 98 or 95. Break below 100 and weak momentum indicators support the move toward 99.418. If DXY holds above 99.418, it may trigger a...
The EUR/USD pair is exhibiting bullish tendencies, with the 50% Fibonacci retracement level at 1.1515 acting as a critical resistance. A break above this level, accompanied by supportive economic indicators and ECB policies, could lead the pair towards the target of 1.15132. Traders should remain vigilant for confirmation signals to assess the likelihood of this...
The EURUSD currency pair remains bullish after successfully retesting key support levels from last week, as indicated by a strong bullish sentiment in the most recent Commitment of Traders (COT) report. This report highlighted a notable increase in long positions, signaling positive sentiment among institutional traders. Furthermore, this week's COT data shows...
The US Dollar Index (DXY) is showing a downward trend as institutional investors continue to prioritize selling over buying. This sentiment is reflected in the increasing number of sell orders compared to buy orders. Key Observations: - DXY price action indicates a bearish trend. - Institutional investors are adding more sells than buys, contributing to the...
The S&P 500 is exhibiting strong bullish momentum, as reflected in the recent price action. Notably, the H4 (4-hour) timeframe indicates sustained upward strength, signaling a continuation of the current bullish trend.
SPX showing strong bullish momentum after confirming a double bottom. Last week’s COT report showed increased institutional longs. Add in a dovish Fed, solid earnings, and low VIX — the setup looks strong. Watching for continuation above key resistance.
Element: Details Trend: Bearish on Daily Bias Zone: Resistance at 100.160 (Monday high) COT Timing: Tuesday close used for sentiment anchor 1H Pattern: M-Pattern confirming rejection Target: 99.200 (Monday low - key support) Outcome: Target hit on Wednesday
Based on 6 consecutive bearish Commitment of Traders (COT) the US Dollar Index (DXY) is exhibiting a sustained bearish momentum, potentially indicating a decline in the US dollar's value relative to other major currencies.
Bearish BTC: Speculators are heavily shorting Bitcoin (bearish COT), the market structure shows lower lows and lower highs, and intraday momentum is bearish, indicating continued downside pressure.
The EUR/USD market initially tested a significant daily resistance zone, which prompted an expected bearish continuation. Following this, the market formed a clear M-pattern, indicating a potential reversal. As the price retested the neckline of the M-pattern, this confirmed the continuation of the bearish trend. Consequently, further selling pressure was...
The US Dollar Index (DXY) remains bullish, with a strong uptrend. The Commitment of Traders (COT) report shows increased long positions from speculators, indicating positive sentiment towards the USD. Rising market participation supports the bullish outlook.
Both DXY and EUR/USD exhibit bullish trends, with the COT report showing strong speculative buying in both markets, indicating positive sentiment for the USD and Euro.
We just rejected daily resistance zone and we can see that our next targe foe barish momentum has just being formed already. So initisl TP will be at 1.10685
Bearish momentum expected for equal low or liquidity sweep, h4 structure concluding our whole momentum to conclude eerything from higher time frame.
Monthly structure indicating bullish momentum till M patten neckline retest to conclude strong bullish momentum and also H4 concluding the same movement so bullish momentum expected.
Trade Direction: Bullish Take-Profit: 3042 Reasoning for Trade: The market shows strong bullish momentum due tointerest rate decisions. Upward movement toward the 3042 level. Market sentiment is favoring risk-off assets, driving demand for gold as a safe-haven investment. Risk-Reward Ratio: 1:3


