ProfittoPath
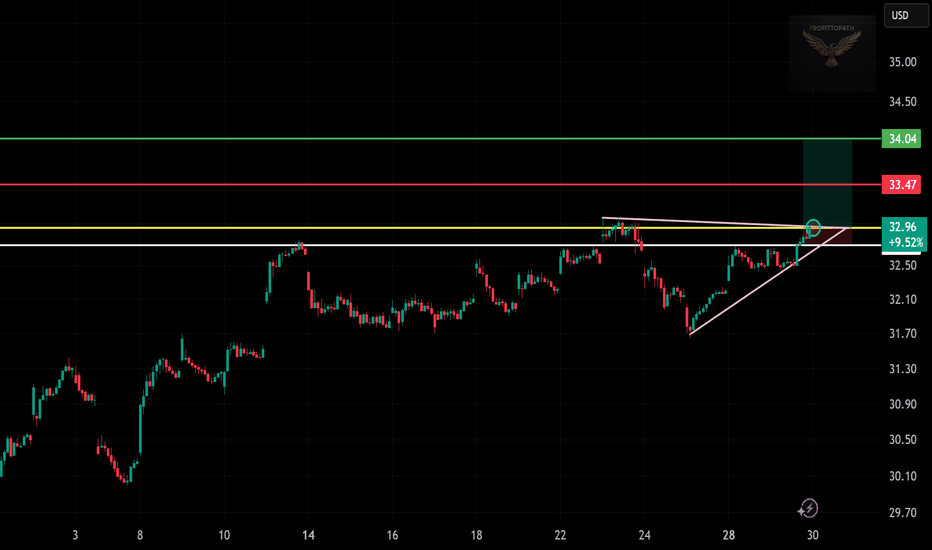
Premium– Triangle Sends a Signal” 📈 Trade Snapshot: BP breaks above resistance with rising volume, forming higher lows on a clean ascending triangle. Breakout above $32.96 opens the door toward $34.04. 🎯 Setup Details: → Entry: $32.96 → SL: ~$32.30 → Target: $34.04 → Resistance to clear: $33.47 📌 Pattern strength + structure breakout = potential momentum run.
resistance after clean higher lows. A breakout above $469.80 could fuel a move toward $471.50. 🎯 Plan: → Entry: $468.41 → SL: Below $466 → Target: $471.50 ⚠️ Wait for confirmation above structure.
📈 Triangle pattern tightening. Entry: $53.10 | SL: ~$52.00 | Target: $55.10 Break above $54.07 = momentum shift. Let price confirm, then strike. 🧠🎯
🟢 You’re expecting price to move upward, and your chart reflects a breakout setup with multiple resistance levels marked. 🔍 Key Technical Elements Noted: Ascending triangle breakout: The pink trendlines show an ascending triangle (bullish pattern) that successfully broke out. Support Zone: Around 158.00 – 158.62 (highlighted by the yellow lines), showing a...
📈 🕰️ Timeframe: 30-minute chart 🔍 Pattern: Bull flag / descending channel breakout 📉 Previous Trend: Uptrend with healthy retracement 🧭 Setup: Breakout from short-term correction, aligning with trendline support 🧩 Technical Breakdown: Support Zones: $83.00 (holding on ascending trendline) $82.50–82.75 (horizontal support near recent consolidation) Entry...
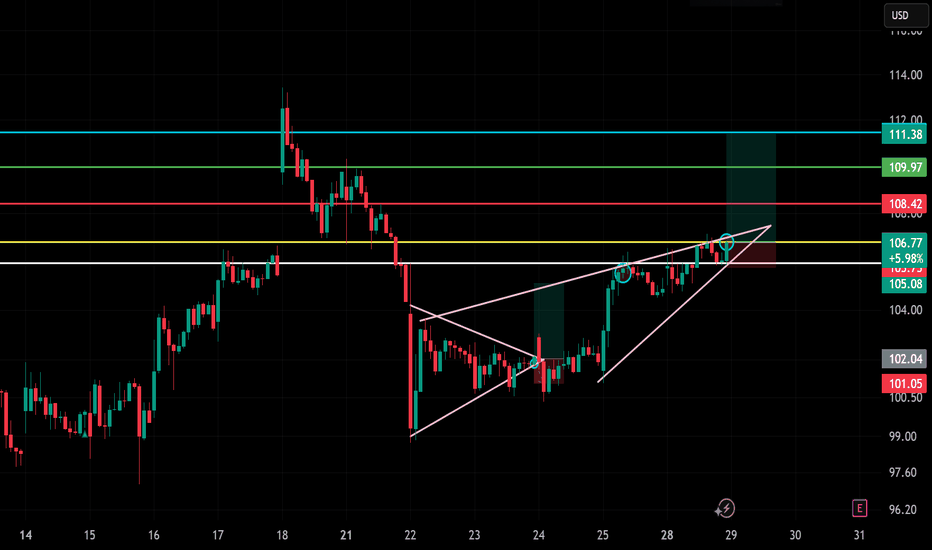
📈 🕰️ Timeframe: 30-minute chart 🔍 Pattern: Ascending wedge breakout 📉 Previous Trend: Bullish continuation from bottom 🧭 Setup: Breakout retest and continuation toward resistance zone 🧩 Technical Breakdown: Breakout Zone: Wedge breakout confirmed around $106.00–106.50 Current price near $106.77, retesting breakout (bullish) Support Zone: $105.00–105.50...
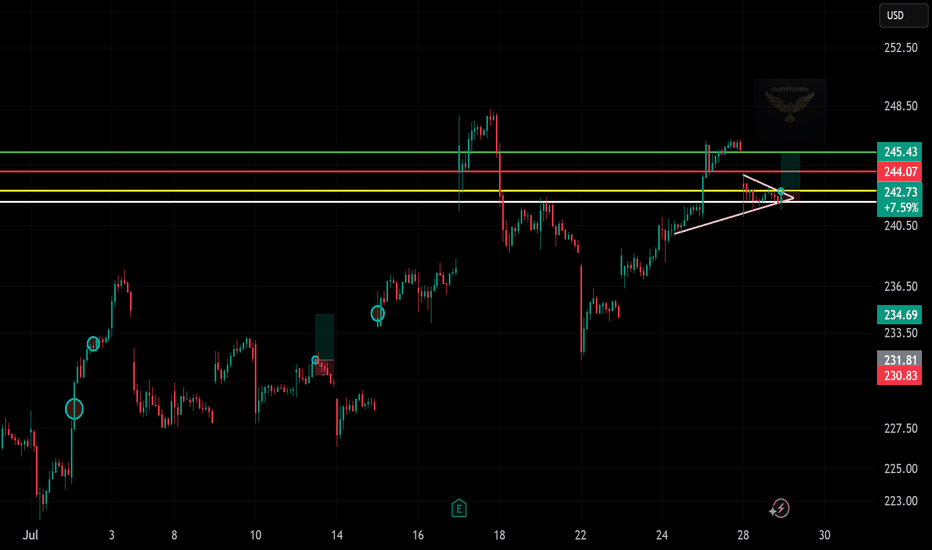
📈 (Taiwan Semiconductor) 🕰️ Timeframe: 30-minute chart 🔍 Pattern: Ascending triangle breakout 📉 Previous Trend: Recovery after drop 🔁 Setup: Bullish continuation with breakout confirmation 🧩 Technical Breakdown: Support Zone: ~$242.50 (yellow horizontal support) Uptrend line holding as dynamic support (pink diagonal) Entry Zone: Around $242.75, just above...
📊 🕰️ Timeframe: 30-minute chart 🔍 Pattern: Falling wedge breakout 📉 Previous Trend: Sharp sell-off 🔁 Setup: Reversal from demand zone with breakout confirmation 🧩 Technical Breakdown: Support Zone: Around $57.00 (highlighted with pink & white lines) Retesting prior breakout + holding demand zone Resistance / Target Zones: TP1: $58.92 (orange line – minor...
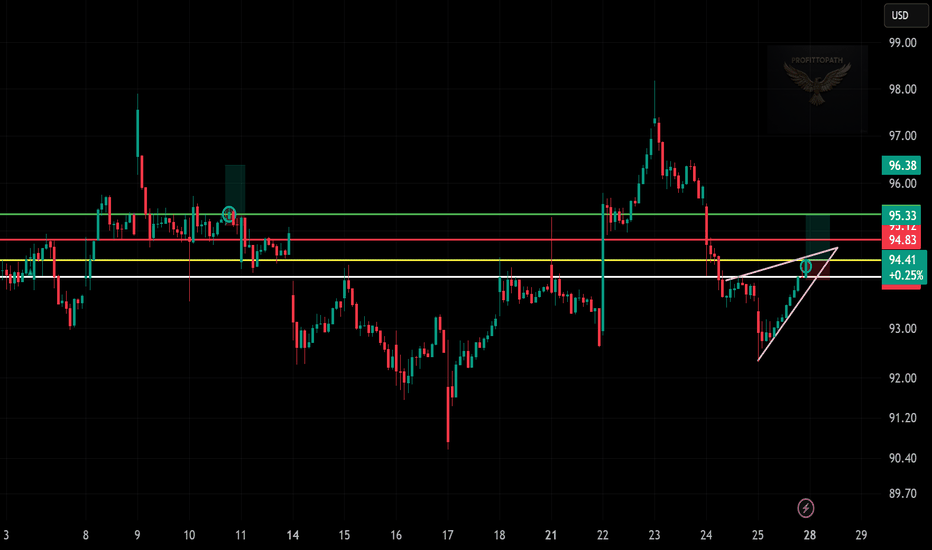
📈 Entry: $94.41 (Breakout above mini wedge) Stop Loss: $93.75 (Below trendline support) Target: $96.38 (Key resistance zone) Pattern: Rising Wedge breakout with bullish momentum Risk-Reward Ratio: ~2.6R Caution Zone: $94.83–$95.33 (multiple rejections in past)
📈 Entry: $54.46 Stop Loss: $53.97 Target: $56.39 Pattern: Rising Wedge Breakout Risk-Reward: ~2R Key Zone: $55.41 (resistance/rejection level to watch)
📈 Entry: $13.71 Stop Loss: $13.59 Target: $13.91 Pattern: Ascending Triangle Breakout Risk-Reward: ~1.7R Key Level to Watch: $13.78 (possible resistance)
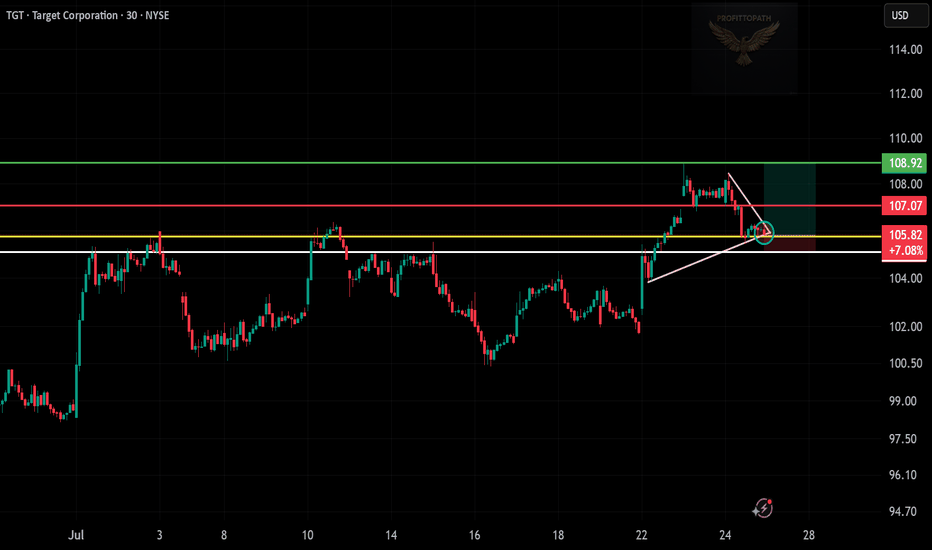
Pattern: Breakout and retest of wedge Entry Zone: Around $105.82 Stop Loss: Below $105.00 (white support line) Target: $108.92 (green resistance zone)
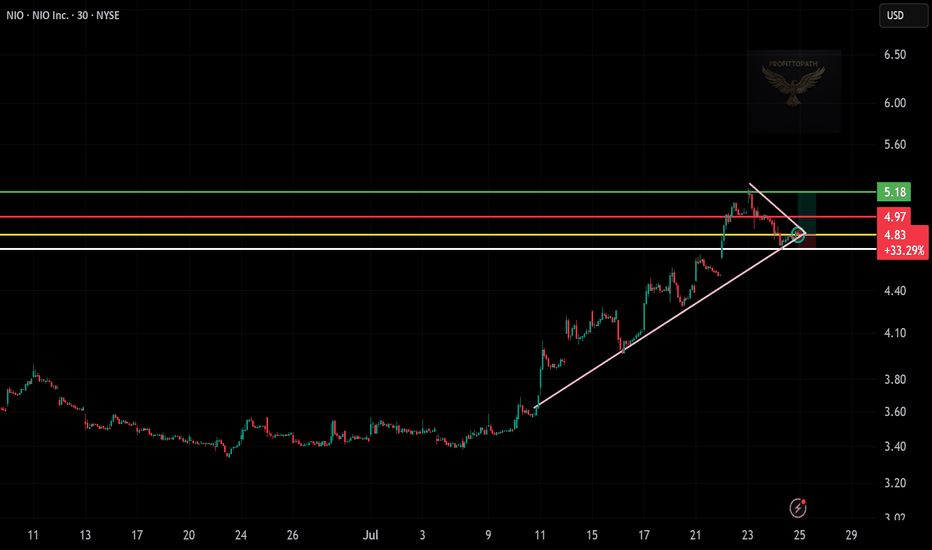
Pattern: Bullish breakout from descending wedge Entry Zone: Around $4.83–$4.97 Stop Loss: Just below $4.70 (trendline + horizontal support) Target: $5.18 (green resistance level)
Pattern: Bullish breakout from descending wedge Entry Zone: Around $4.83–$4.97 Stop Loss: Just below $4.70 (trendline + horizontal support) Target: $5.18 (green resistance level)
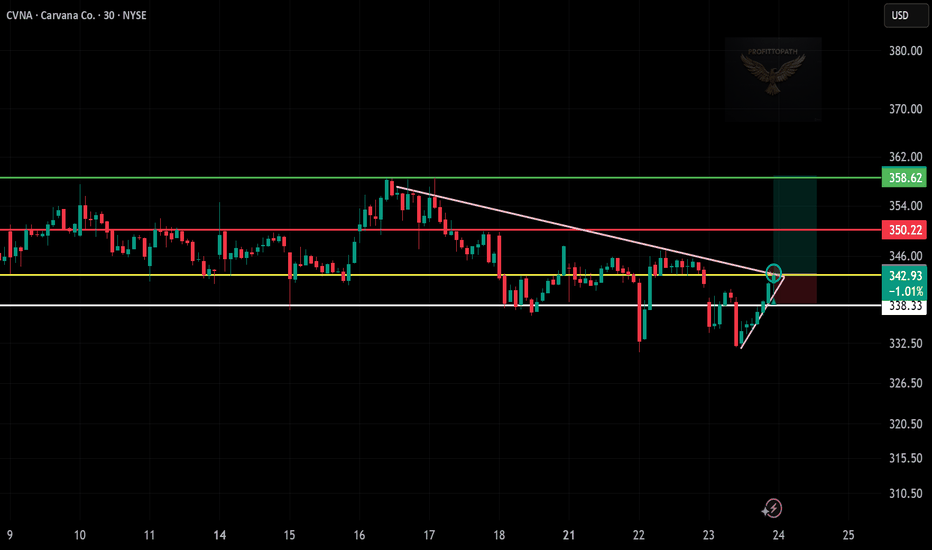
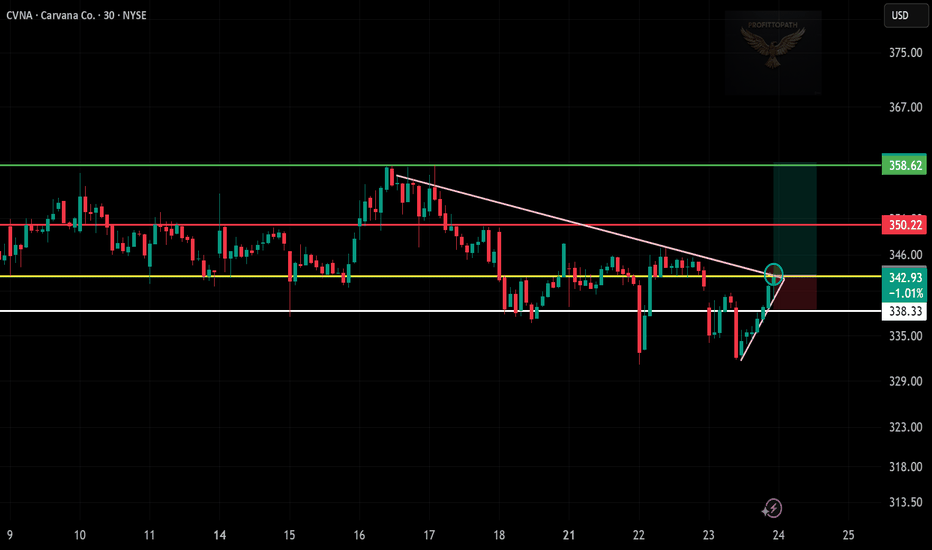
Entry Zone: Around 342.93 Stop Loss: Below 338.33 (support zone) Targets: Target 1: 350.22 (resistance) Target 2: 358.62 (top green level)
Pattern: Breakout from descending trendline (pink) Entry Zone: Around 43.28 (breakout zone) Stop Loss: Below 42.75 (recent support zone) Targets: Target 1: 44.21 (red resistance) Target 2: 45.57 (top green line)
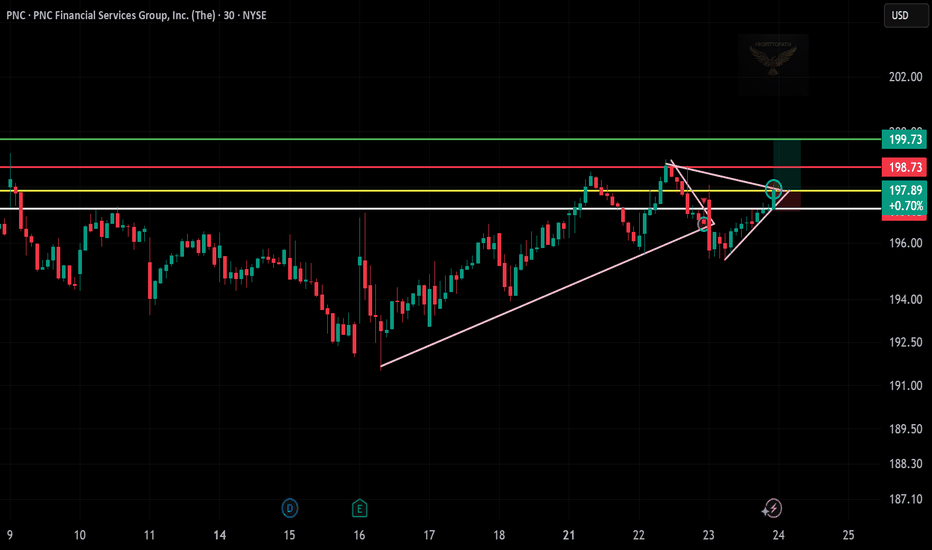
Pattern: Breakout from triangle (pink lines) Entry Zone: Around 197.89 (breakout level) Stop Loss: Just below 197.15 (previous resistance/support) Targets: Target 1: 198.73 (first red resistance) Target 2: 199.73 (top green line)
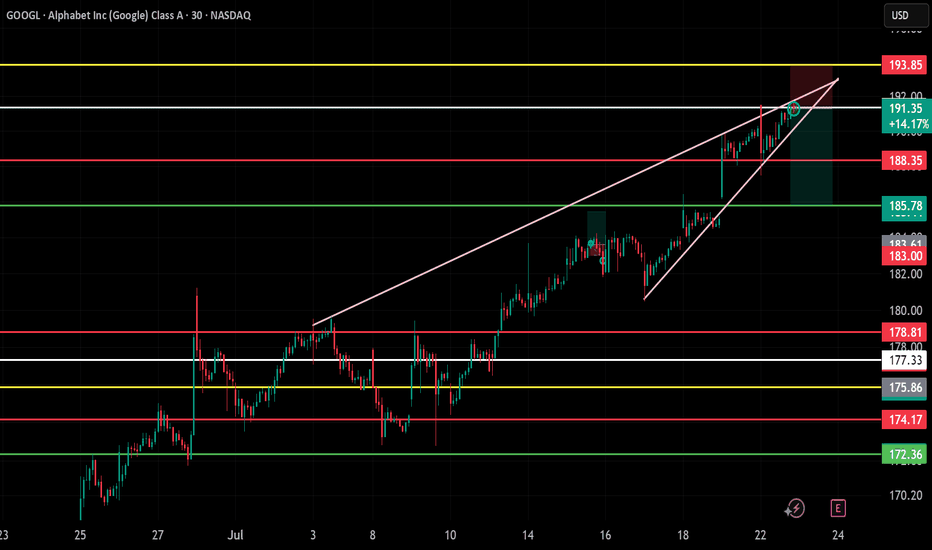
📌 Entry: 191.35 Target: 185.78 Stop-Loss: 193.85 Setup: Rising Wedge Breakdown Bias: Bearish
