ProfittoPath
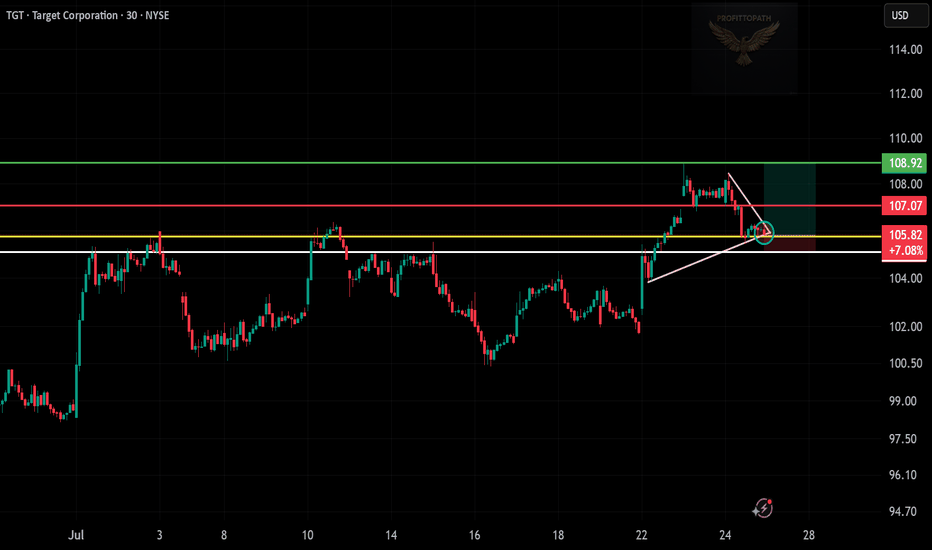
PremiumPattern: Breakout and retest of wedge Entry Zone: Around $105.82 Stop Loss: Below $105.00 (white support line) Target: $108.92 (green resistance zone)
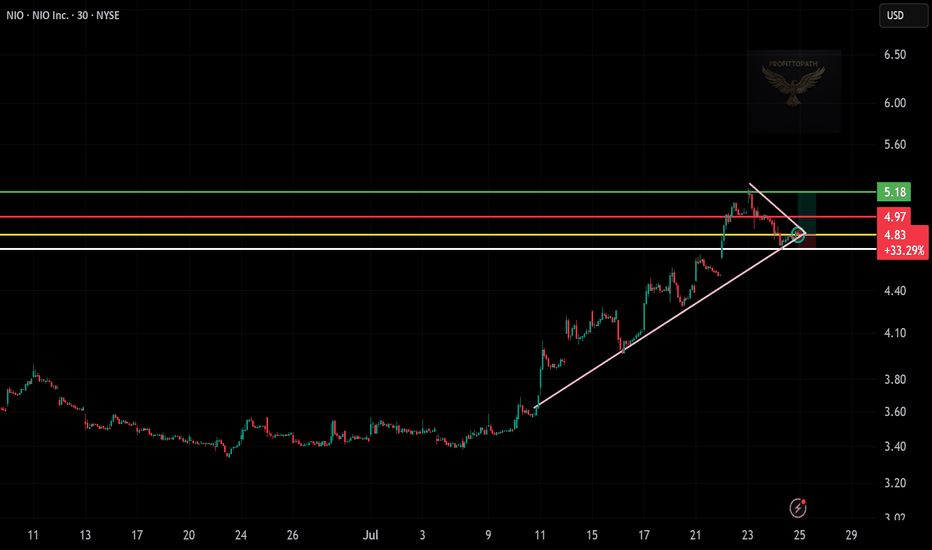
Pattern: Bullish breakout from descending wedge Entry Zone: Around $4.83–$4.97 Stop Loss: Just below $4.70 (trendline + horizontal support) Target: $5.18 (green resistance level)
Pattern: Bullish breakout from descending wedge Entry Zone: Around $4.83–$4.97 Stop Loss: Just below $4.70 (trendline + horizontal support) Target: $5.18 (green resistance level)
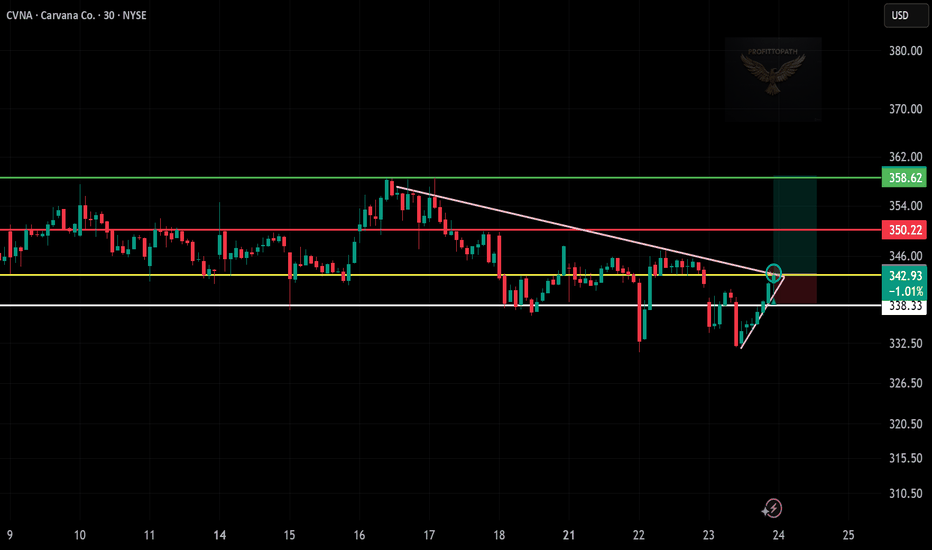
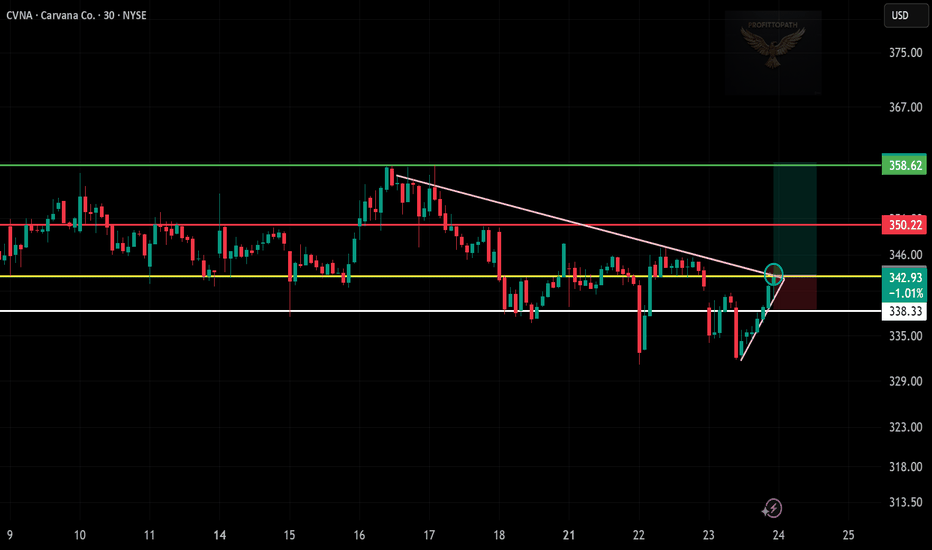
Entry Zone: Around 342.93 Stop Loss: Below 338.33 (support zone) Targets: Target 1: 350.22 (resistance) Target 2: 358.62 (top green level)
Pattern: Breakout from descending trendline (pink) Entry Zone: Around 43.28 (breakout zone) Stop Loss: Below 42.75 (recent support zone) Targets: Target 1: 44.21 (red resistance) Target 2: 45.57 (top green line)
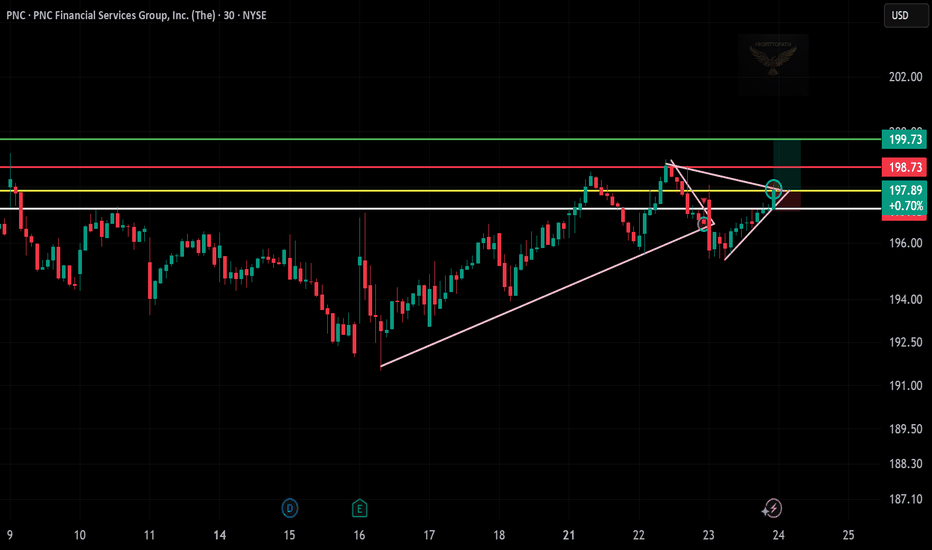
Pattern: Breakout from triangle (pink lines) Entry Zone: Around 197.89 (breakout level) Stop Loss: Just below 197.15 (previous resistance/support) Targets: Target 1: 198.73 (first red resistance) Target 2: 199.73 (top green line)
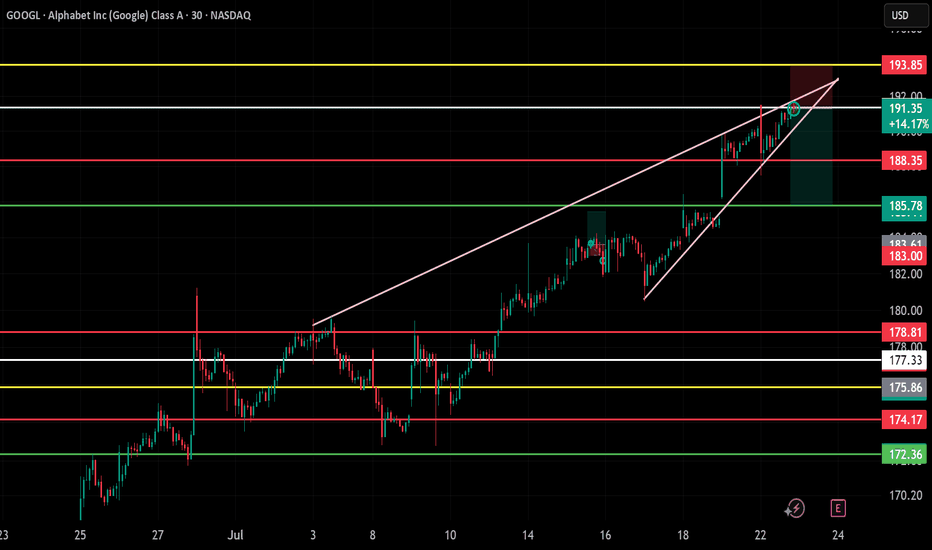
📌 Entry: 191.35 Target: 185.78 Stop-Loss: 193.85 Setup: Rising Wedge Breakdown Bias: Bearish
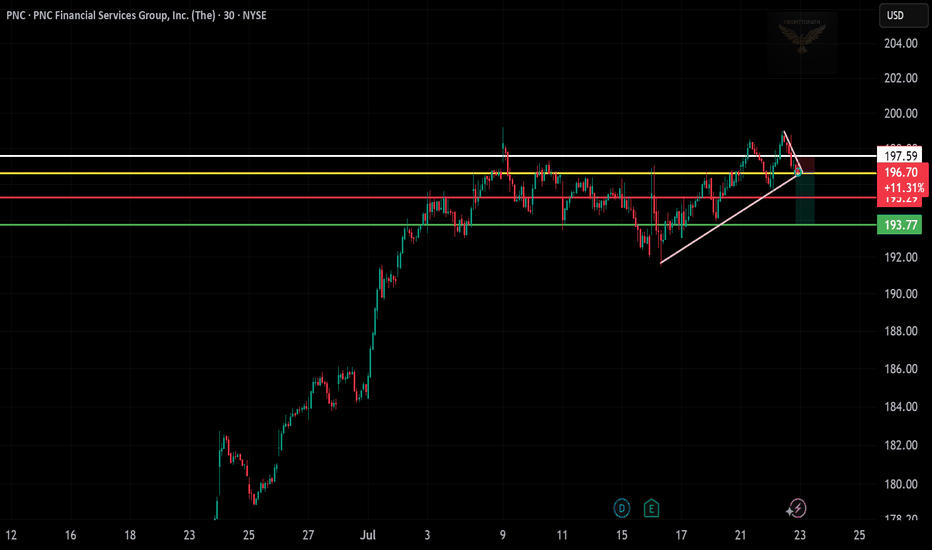
📌 Entry: 196.70 Target: 193.77 Stop: 197.59 Setup: Rising Wedge Breakdown Bias: Bearish
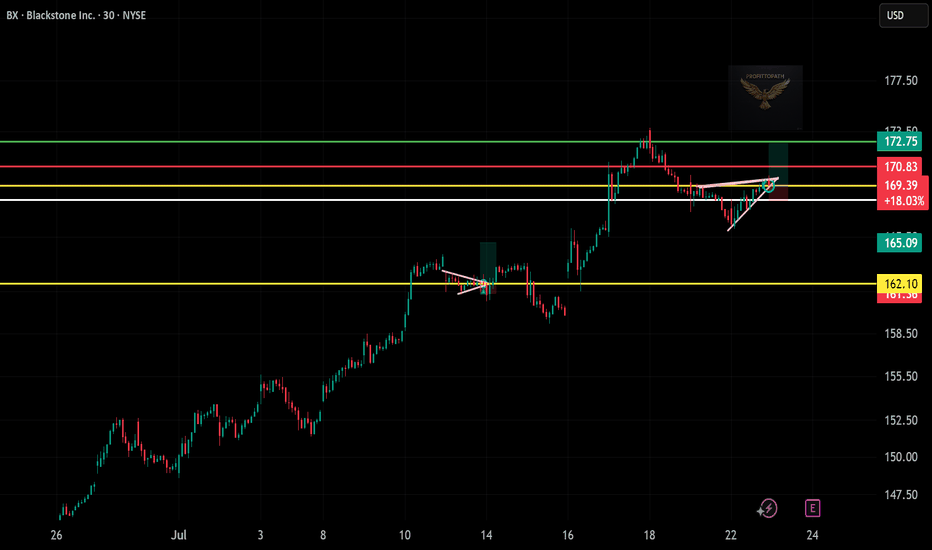
📈 🔍 Pattern: Falling Wedge Breakout + Bullish Flag 📍 Entry: ~$169.39 🎯 Target: $172.75 🛑 Stop: ~$168.20 🧠 Bias: Bullish – Strong support reclaim + momentum building
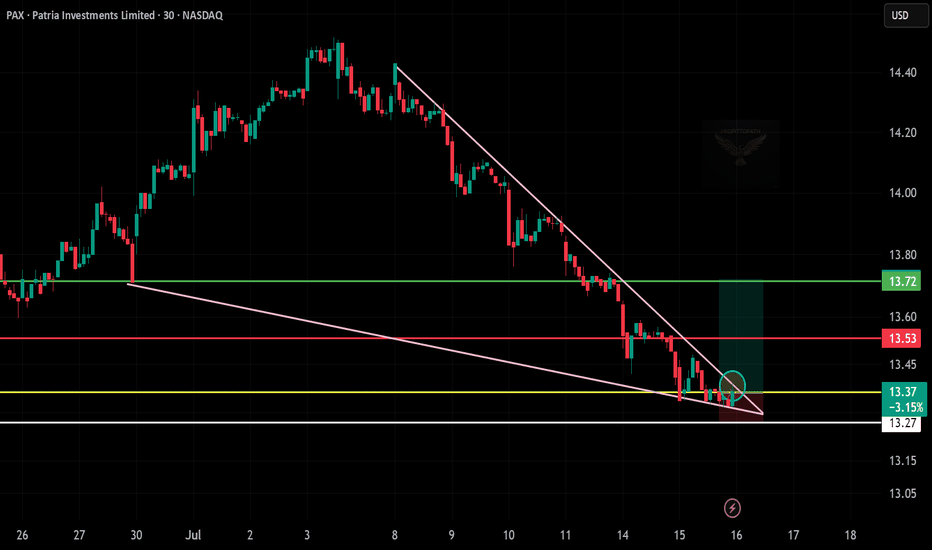
🧠 Chart Analysis Summary: Pattern: Falling wedge breakout spotted — a classic bullish reversal pattern. Current Price: $13.37 Support Zone: $13.27 (white line, holding support) Breakout Confirmation: Price is pushing out of the wedge with a small green move (circle). 📊 Key Levels: Entry Zone: $13.35–$13.40 Target 1: $13.53 (red line – short-term...
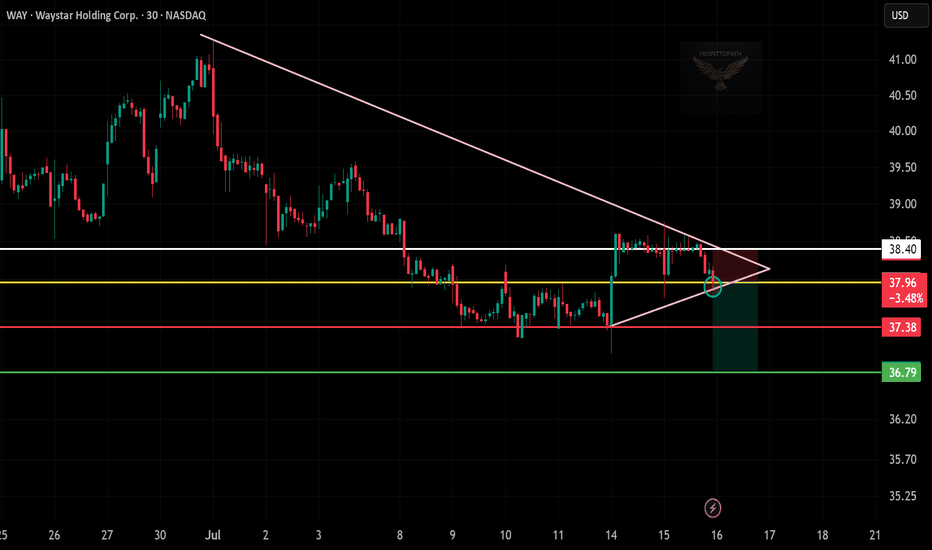
🧠 Chart Analysis Summary: Pattern: Breakdown from a symmetrical triangle (pink lines), signaling bearish pressure. Current Price: $37.96 Breakdown Confirmation: Price broke triangle support with bearish follow-through. Resistance Zone: Immediate Resistance: $38.40 (white line) Support Levels: First: $37.38 (red line) Final Target: $36.79 (green zone) 🎯...
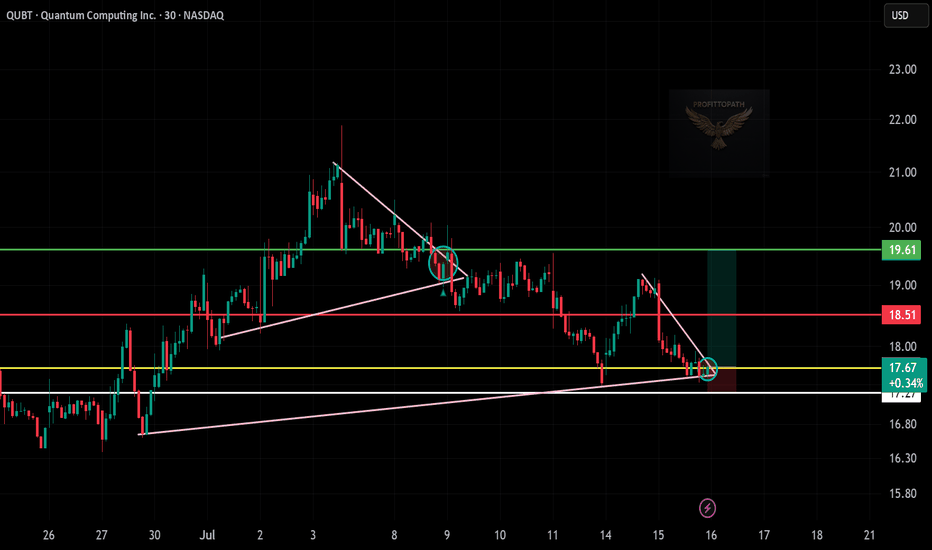
🧠 Chart Analysis Summary: Setup: QUBT bounced off a long-term ascending trendline (pink), with potential reversal from support. Current Price: $17.67 Breakout Zone: A breakout from the small falling wedge/pennant pattern appears underway. Support Zone: Around $17.25–17.50 (white/yellow lines) Target Zone: First Target: $18.51 (red line) Final Target:...
+ 🧠 Chart Analysis Summary: Pattern: Symmetrical triangle breakout has occurred. Momentum is building. Current Price: $288.58 Breakout Confirmation: Price closed above resistance trendline (pink), signaling potential bullish move. 📊 Key Levels: Entry Zone: $288.50–289.00 Resistance/Targets: Minor Resistance: $291.87 (red line) Main Target: $295.54 (green...
🧠 Chart Breakdown: Setup: Price broke out of a large ascending triangle and is now forming a mini symmetrical triangle — a consolidation before a possible continuation. Current Price: $99.94 Breakout Zone: Near $100, close to decision point. 📊 Key Levels: Immediate Resistance: $101.09 (yellow) $102.44 (first green target) $103.50 (final target...
🧠 Chart Analysis Summary: Pattern: A symmetrical triangle is visible, tightening toward the apex with a breakout just forming. Current Price: $472.47 (breakout near) Key Levels: Support Zone: Around $468–470 (white/yellow zone) Resistance Zone: First Target: $477.01 (red line) Major Target: $482.20 (green line) Volume Confirmation: Suggested to confirm...
📊 ⏱️ Timeframe: 30-minute chart 📍 Technical Highlights: Ascending triangle breakout near $104.25 (confirmed) Strong base forming above $103 (white and yellow support lines) Price trying to break $105 resistance (red line) for further upside 🎯 Targets: TP1: $105.81 TP2: $106.39 (Both marked in light blue — recent resistance zone) 🔐 Risk Management: Entry:...
📊 ⏱️ Timeframe: 30-minute chart 📍 Technical Highlights: Bullish pennant breakout forming after a strong uptrend (continuation pattern ✅) Breakout area: Around $163 (red resistance) Support held near $162 zone (white/yellow lines) 🎯 Targets: TP1: $164.15 TP2: $165.05 (Both resistance levels marked in light blue) 🔐 Risk Management: Entry: ~$163 (after pennant...
📊 🕒 Timeframe: 30-minute chart 📍 Technical Overview: Falling wedge breakout detected ✅ Support zone: $111.50–$112 (held well) Breakout confirmation near $113 Target zones: TP1 🎯: $116.48 (green resistance) TP2 🎯: $118.25 (major resistance) 🔐 Risk Management: Stop loss: Below $111.50 (white support) Risk–Reward Ratio: Over 2:1 ✅ 📈 Trade Plan...
