📈 🔹 Ticker: HIMS (NYSE) 🔹 Timeframe: 30-Min 🔹 Setup Type: Falling Trendline Break + Support Bounce 🔸 Price at Breakout: ~$29.55 📊 Trade Plan (Long Position) ✅ Entry Zone: $29.50–$30.00 (breakout above yellow zone + trendline break) ✅ Stop Loss (SL): Below $28.50 (white support line & structure low) ✅ Take Profit Targets: 📌 TP1: $30.84 (red line – supply zone /...
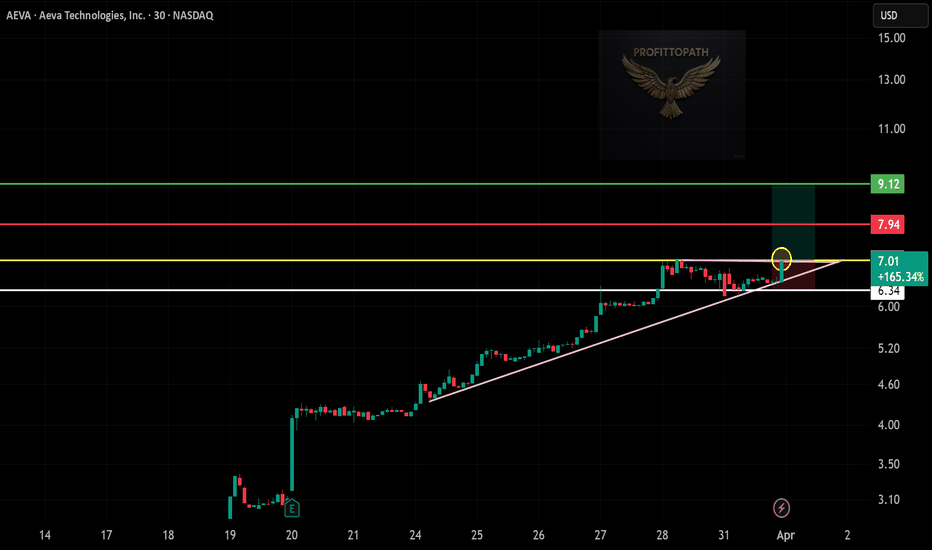
📈 🔹 Asset: AEVA Technologies 🔹 Timeframe: 30-Min 🔹 Setup Type: Ascending Triangle Breakout + Support Hold 🔸 Price at Breakout: ~$7.01 📊 Trade Plan (Long Position) ✅ Entry Zone: $7.00–$7.10 (breakout candle above trendline + yellow resistance zone) ✅ Stop Loss (SL): Below $6.34 (white horizontal support line) ✅ Take Profit Targets: 📌 TP1: $7.94 (red line – recent...
📈🚀 🔹 Asset: CIVI (NYSE) 🔹 Timeframe: 30-Min Chart 🔹 Setup Type: Falling Trendline Break + Support Bounce 📊 Trade Plan (Long Position) ✅ Entry Zone: Around $35.00 (trendline break + demand zone confirmation) ✅ Stop-Loss (SL): Below $34.36 (clear structure support zone) 🎯 Take Profit Targets 📌 TP1: $35.85 (immediate resistance / supply zone) 📌 TP2: $36.94...
My Targeted Price is $86111 Its Bulliesh now a VERY Perfect break out..
✅ Entry taken after a clear breakout from the falling trendline ✅ Support zone held strong, showing buyer strength ✅ Green target zone marked above resistance, aiming for a breakout continuation ✅ Stop-loss set just below recent support to manage risk 📌 Risk-to-reward looks favorable for a potential bullish move
: 📈 🚀 🔹 Asset: RDW (NYSE) 🔹 Timeframe: 30-Min Chart 🔹 Setup Type: Falling Wedge Breakout + Base Formation 📊 Trade Plan (Long Position) ✅ Entry Zone: Around $8.90 (wedge breakout + price base confirmation) ✅ Stop-Loss (SL): Below $8.40 (structure support & risk protection zone) 🎯 Take Profit Targets 📌 TP1: $9.37 (immediate resistance / consolidation zone) 📌 TP2:...
📈 🚀 🔹 Asset: AVGX (NASDAQ) 🔹 Timeframe: 30-Min Chart 🔹 Setup Type: Falling Wedge Breakout + Support Bounce 📊 Trade Plan (Long Position) ✅ Entry Zone: Around $15.00 (breakout confirmation + retest bounce) ✅ Stop-Loss (SL): Below $14.55 (recent low & demand zone) 🎯 Take Profit Targets 📌 TP1: $15.99 (gap-fill zone / supply area) 📌 TP2: $17.12 (strong resistance...
📈 🚀 🔹 Asset: NVCT (NASDAQ) 🔹 Timeframe: 30-Min Chart 🔹 Setup Type: Ascending Trendline Breakout + Resistance Flip 📊 Trade Plan (Long Position) ✅ Entry Zone: Above $10.40 (breakout and close confirmation) ✅ Stop-Loss (SL): Below $9.77 (trendline support + previous low) 🎯 Take Profit Targets 📌 TP1: $11.30 (previous resistance/supply zone) 📌 TP2: $12.48 (measured...
📈 🚀 🔹 Asset: SKYH (NYSE) 🔹 Timeframe: 30-Min Chart 🔹 Setup Type: Bullish Flag Breakout + Volume Surge 📊 Trade Plan (Long Position) ✅ Entry Zone: Above $13.70 (breakout candle + volume confirmation) ✅ Stop-Loss (SL): Below $12.94 (support zone + previous structure low) 🎯 Take Profit Targets 📌 TP1: $14.75 (previous supply/resistance level) 📌 TP2: $16.02 (measured...
Bitcoin is showing signs of a potential reversal after a strong downtrend. Price is consolidating near key support with a breakout from the descending trendline, signaling a possible long opportunity. Watching closely for momentum confirmation and volume support.
Watch how Bitcoin reacts to major support and resistance zones with precise price action! This 30-min chart shows multiple breakouts, retests, and trendline shifts—perfect for short-term traders looking for entries and exits. Keep an eye on those yellow zones and structure shifts!
📈 🚀 🔹 Asset: GRPN (NASDAQ) 🔹 Timeframe: 30-Min Chart 🔹 Setup Type: Ascending Triangle Breakout + Resistance Flip 📊 Trade Plan (Long Position) ✅ Entry Zone: Above $18.82 (Breakout zone + confluence) ✅ Stop-Loss (SL): Below $18.36 (Trendline + recent low) 🎯 Take Profit Targets 📌 TP1: $19.31 (Key resistance / supply zone) 📌 TP2: $19.95 (Measured breakout target /...
📈 🚀 🔹 Asset: MNPR (NASDAQ) 🔹 Timeframe: 30-Min Chart 🔹 Setup Type: Falling Wedge Breakout + Trendline Support 📊 Trade Plan (Long Position) ✅ Entry Zone: Above $39.96 (Breakout confirmation) ✅ Stop-Loss (SL): Below $36.35 (Wedge base & prior support) 🎯 Take Profit Targets 📌 TP1: $46.00 (Previous resistance zone) 📌 TP2: $52.69 (Major resistance / measured move...
📈 🚀 🔹 Asset: TNXP (NASDAQ) 🔹 Timeframe: 30-Min Chart 🔹 Setup Type: Symmetrical Triangle Breakout + Trendline Support 📊 Trade Plan (Long Position) ✅ Entry Zone: Above $26.53 (Breakout zone + trendline support) ✅ Stop-Loss (SL): Below $23.81 (Previous support & trendline base) 🎯 Take Profit Targets 📌 TP1: $31.64 (Previous resistance zone) 📌 TP2: $37.76 (Major...
📊 🔹 Chart Pattern Overview: The chart shows a series of trendline breaks forming ascending and descending channels. Multiple higher highs and lower lows were marked with circles. You’ve mapped clear price action structures with zigzag movements indicating market swings. 🔄 Trend Shifts & Trade Zones: Initial bullish structure breaks upward, followed by a sharp...
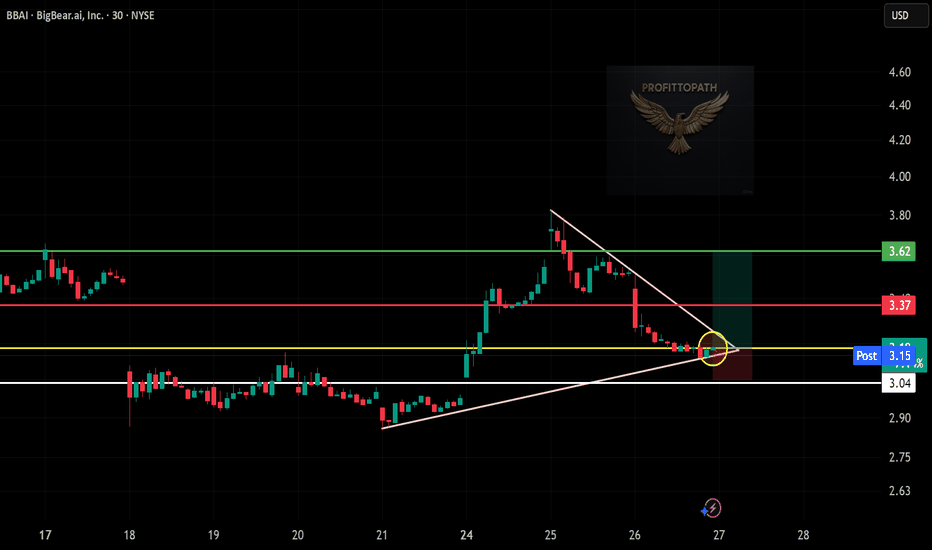
📊 B – Trendline Support + Wedge Squeeze 🚀 BBAI is forming a bullish wedge pattern with price respecting ascending support at $3.04. Momentum is compressing near the apex, hinting at a potential breakout. A clean breakout above $3.15 may trigger a strong upside move. ✅ Trade Plan (Long Position) • Entry: Breakout confirmation above $3.15 • Stop-Loss: Below $3.04...
📊 Falling Wedge Breakout Forming 🚀 SMCI is showing signs of a bullish reversal after a strong downtrend. Price is consolidating inside a falling wedge pattern and now testing support near $36.55. This setup offers a high reward-to-risk opportunity for an upside breakout. ✅ Trade Plan (Long Position) • Entry: Above $37.05 (wedge breakout confirmation) • Stop-Loss:...
📊 Trendline Respect + Momentum Shift 🚀 This chart shows a bullish wedge breakout forming above a strong ascending trendline, holding above key structure levels. Buyers are defending support and building pressure for a breakout. ✅ Trade Plan (Long Position) • Entry: Above $7.88 (breakout confirmation) • Stop-Loss: Below $7.37 (trendline + support zone) 🎯 Take...


