📊 – 30-Min Chart 📉 Setup Type: Rising Wedge Breakdown (Bearish Reversal) 🔻 Trade Plan (Short Position) ✅ Entry Zone: Below $7.27 (Breakdown Confirmation) ✅ Stop-Loss (SL): Above $7.49 (Key Resistance Level) 🎯 Take Profit Targets (TPs) 📌 TP1: $7.00 (Support Level) 📌 TP2: $6.69 (Key Demand Zone) 📌 TP3: $6.60 (Major Support & Psychological Level) 📊 Risk-Reward...
📊– 30-Min Chart 📉 Setup Type: Rising Wedge Breakdown (Bearish Reversal) 🔻 Trade Plan (Short Position) ✅ Entry Zone: Below $8.78 (Breakdown Confirmation) ✅ Stop-Loss (SL): Above $9.52 (Key Resistance Level) 🎯 Take Profit Targets (TPs) 📌 TP1: $7.81 (Support Level) 📌 TP2: $6.60 (Key Demand Zone) 📌 TP3: $6.00 (Major Support & Psychological Level) 📊 Risk-Reward...
📊 Stock Analysis: HNRG (Hallador Energy Company) – 30-Min Chart 📉 Setup Type: Rising Wedge Breakdown (Bearish Reversal) 🔻 Trade Plan (Short Position) ✅ Entry Zone: Below $12.56 (Breakdown Confirmation) ✅ Stop-Loss (SL): Above $12.92 (Key Resistance Level) 🎯 Take Profit Targets (TPs) 📌 TP1: $12.00 (Support Level) 📌 TP2: $11.54 (Key Demand Zone) 📌 TP3: $11.00...
ACHC – 30-Min Long Trade Setup 📈🚀 🔹 Asset: ACHC – Acadia Healthcare Company, Inc. (NASDAQ) 🔹 Timeframe: 30-Min Chart 🔹 Setup Type: Bullish Breakout (Trendline Break + Momentum Shift) 📊 Trade Plan (Long Position) ✅ Entry Zone: Above $29.55 (Breakout Confirmation) ✅ Stop-Loss (SL): Below $28.68 (Key Support Level) 🎯 Take Profit Targets (TPs) 📌 TP1: $30.95...
🚀 🔹 Asset: TGTX – NASDAQ 🔹 Timeframe: 30-Min Chart 🔹 Setup Type: Bullish Breakout (Rising Wedge & Fibonacci Retracement) 📊 Trade Plan (Long Position) ✅ Entry Zone: Above $42.50 (Breakout Confirmation) ✅ Stop-Loss (SL): Below $40.17 (Key Support Level) 🎯 Take Profit Targets 📌 TP1: $43.71 (Resistance Level) 📌 TP2: $44.95 (Extended Bullish Move) 📊 Risk-Reward...
🚀 🔹 Asset: HYPR – NASDAQ 🔹 Timeframe: 30-Min Chart 🔹 Setup Type: Bullish Reversal (Falling Wedge & Fibonacci Retracement) 📊 Trade Plan (Long Position) ✅ Entry Zone: Above $0.86 (Breakout Confirmation) ✅ Stop-Loss (SL): Below $0.79 (Key Support Level) 🎯 Take Profit Targets 📌 TP1: $0.95 (Resistance Level) 📌 TP2: $1.05 (0.618 Fibonacci Retracement) 📌 TP3: $1.11...
🚀 🔹 Asset: ADMA – NASDAQ 🔹 Timeframe: 30-Min Chart 🔹 Setup Type: Bullish Breakout (Rising Wedge & Fibonacci Confluence) 📊 Trade Plan (Long Position) ✅ Entry Zone: Above $20.60 (Breakout Confirmation) ✅ Stop-Loss (SL): Below $19.75 (Key Support Level) 🎯 Take Profit Targets 📌 TP1: $21.68 (Resistance Level) 📌 TP2: $23.20 (Extended Bullish Move) 📊 Risk-Reward...
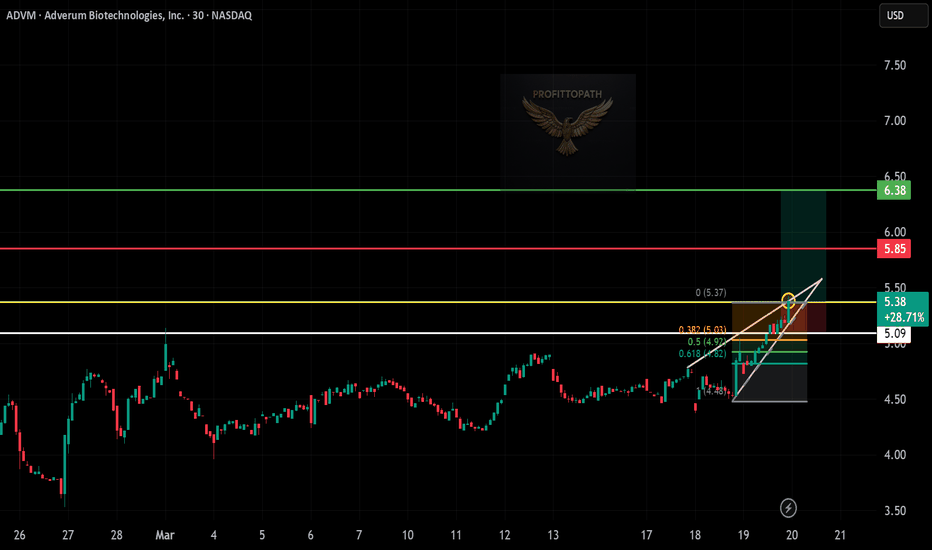
🚀 🔹 Asset: ADVM – NASDAQ 🔹 Timeframe: 30-Min Chart 🔹 Setup Type: Bullish Breakout (Rising Wedge & Fibonacci Confluence) 📊 Trade Plan (Long Position) ✅ Entry Zone: Above $5.38 (Breakout Confirmation) ✅ Stop-Loss (SL): Below $5.09 (Key Support Level) 🎯 Take Profit Targets 📌 TP1: $5.85 (Resistance Level) 📌 TP2: $6.38 (Extended Bullish Move) 📊 Risk-Reward Ratio...
📉🚨 🔹 Asset: Bitcoin – BTC/USD 🔹 Timeframe: 30-Min Chart 🔹 Setup Type: Bearish Breakdown (Rising Wedge Reversal with Fibonacci Confluence) 📊 Trade Plan (Short Position) ✅ Entry Zone: Below $85,700 (Breakdown Confirmation) ✅ Stop-Loss (SL): Above $86,413 (Key Resistance Level) 🎯 Take Profit Targets 📌 TP1: $84,135 (Support Level) 📌 TP2: $83,025 (0.5 Fibonacci...
📉🚨 🔹 Asset: XRP – Crypto Market Cap 🔹 Timeframe: 30-Min Chart 🔹 Setup Type: Bearish Breakdown (Rising Wedge Reversal with Fibonacci Retracement) 📊 Trade Plan (Short Position) ✅ Entry Zone: Below $144.00B (Breakdown Confirmation) ✅ Stop-Loss (SL): Above $145.89B (Key Resistance Level) 🎯 Take Profit Targets 📌 TP1: $139.90B (0.5 Fibonacci Level) 📌 TP2: $137.33B...
🚀 🔹 Asset: AMSC – NASDAQ 🔹 Timeframe: 30-Min Chart 🔹 Setup Type: Bullish Breakout (Symmetrical Triangle Pattern) 📊 Trade Plan (Long Position) ✅ Entry Zone: Above $19.65 (Breakout Confirmation) ✅ Stop-Loss (SL): Below $19.25 (Key Support Level) 🎯 Take Profit Targets 📌 TP1: $20.24 (Resistance Level) 📌 TP2: $20.91 (Extended Bullish Move) 📊 Risk-Reward Ratio...
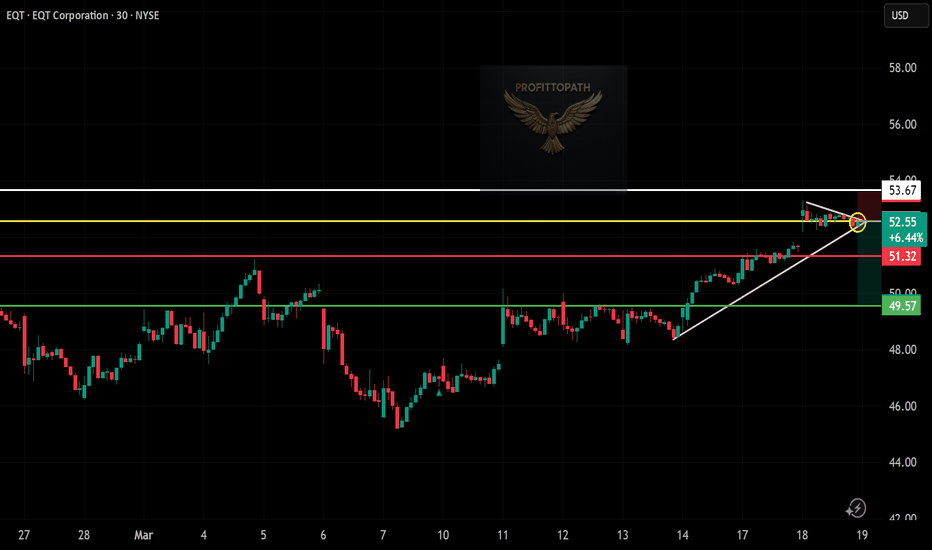
📉🚨 🔹 Asset: EQT – NYSE 🔹 Timeframe: 30-Min Chart 🔹 Setup Type: Bearish Breakdown (Rising Wedge Reversal) 📊 Trade Plan (Short Position) ✅ Entry Zone: Below $52.50 (Breakdown Confirmation) ✅ Stop-Loss (SL): Above $53.67 (Key Resistance Level) 🎯 Take Profit Targets 📌 TP1: $51.32 (Support Level) 📌 TP2: $49.57 (Extended Bearish Move) 📊 Risk-Reward Ratio...
📉🚨 🔹 Asset: AG – NYSE 🔹 Timeframe: 30-Min Chart 🔹 Setup Type: Bearish Breakdown (Ascending Triangle Failure) 📊 Trade Plan (Short Position) ✅ Entry Zone: Below $7.20 (Breakdown Confirmation) ✅ Stop-Loss (SL): Above $7.50 (Key Resistance Level) 🎯 Take Profit Targets 📌 TP1: $7.00 (Support Level) 📌 TP2: $6.42 (Extended Bearish Move) 📊 Risk-Reward Ratio...
📉🚨 🔹 Asset: FINV – NYSE 🔹 Timeframe: 30-Min Chart 🔹 Setup Type: Bearish Breakdown (Rising Wedge Pattern) 📊 Trade Plan (Short Position) ✅ Entry Zone: Below $10.65 (Breakdown Confirmation) ✅ Stop-Loss (SL): Above $11.27 (Key Resistance Level) 🎯 Take Profit Targets 📌 TP1: $10.05 (Support Level) 📌 TP2: $9.26 (Extended Bearish Move) 📊 Risk-Reward Ratio Calculation 📉...
🚀 🔹 Asset: OXY – NYSE 🔹 Timeframe: 30-Min Chart 🔹 Setup Type: Bullish Breakout (Ascending Triangle Pattern) 📊 Trade Plan (Long Position) ✅ Entry Zone: Above $47.50 (Breakout Confirmation) ✅ Stop-Loss (SL): Below $46.53 (Key Support Level) 🎯 Take Profit Targets: 📌 TP1: $47.92 (Previous Resistance Level) 📌 TP2: $48.93 (Extended Bullish Move) 📊 Risk-Reward Ratio...
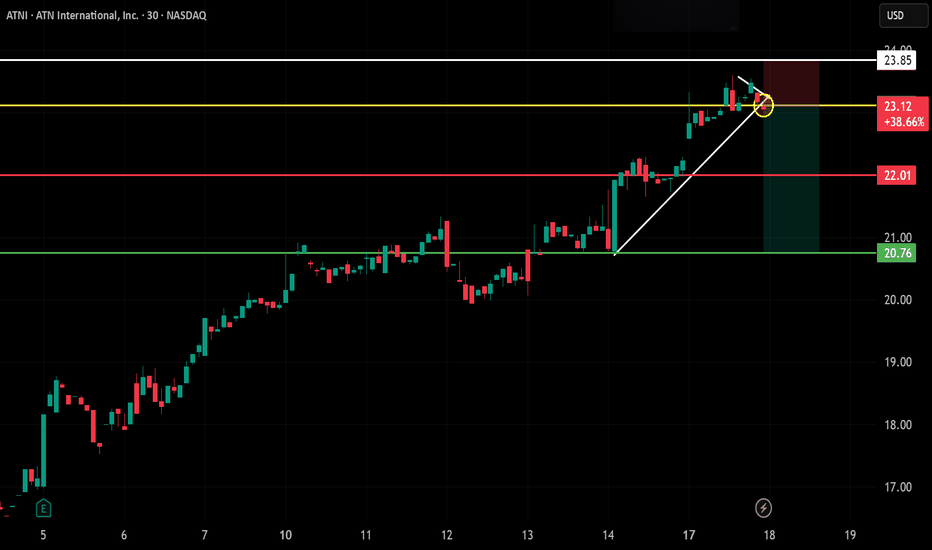
📌 🚀 🔹 Asset: ATN International, Inc. (ATNI – NASDAQ) 🔹 Timeframe: 30-Min Chart 🔹 Setup Type: Rising Wedge Breakdown 📊 Trade Plan (Short Position) ✅ Entry Zone: Below $23.12 (Breakdown Confirmation) ✅ Stop-Loss (SL): Above $23.85 (Key Resistance Level) 🎯 Take Profit Targets: 📌 TP1: $22.01 (First Support Level) 📌 TP2: $20.76 (Extended Bearish Move) 📊 Risk-Reward...
📌 🚀 🔹 Asset: Tourmaline Bio, Inc. (TRML – NASDAQ) 🔹 Timeframe: 30-Min Chart 🔹 Setup Type: Symmetrical Triangle Breakout 📊 Trade Plan (Long Position) ✅ Entry Zone: Above $18.27 (Breakout Confirmation) ✅ Stop-Loss (SL): Below $17.95 (Key Support Level) 🎯 Take Profit Targets: 📌 TP1: $18.91 (First Resistance Level) 📌 TP2: $19.62 (Extended Bullish Move) 📊...
📊 ✅ Setup Type: Symmetrical Triangle Breakout ✅ Entry Zone: Above $14.24 (Breakout Confirmation) ✅ Stop-Loss: Below $13.65 (Key Support Level) 🎯 Take Profit Targets: 📌 TP1: $15.10 (First Resistance Level) 📌 TP2: $16.19 (Extended Bullish Move) 📊 Risk-Reward Calculation: 📉 Risk (SL Distance): $14.24 - $13.65 = $0.59 risk per share 📈 Reward to TP1: $15.10 -...


