ProjectSyndicate
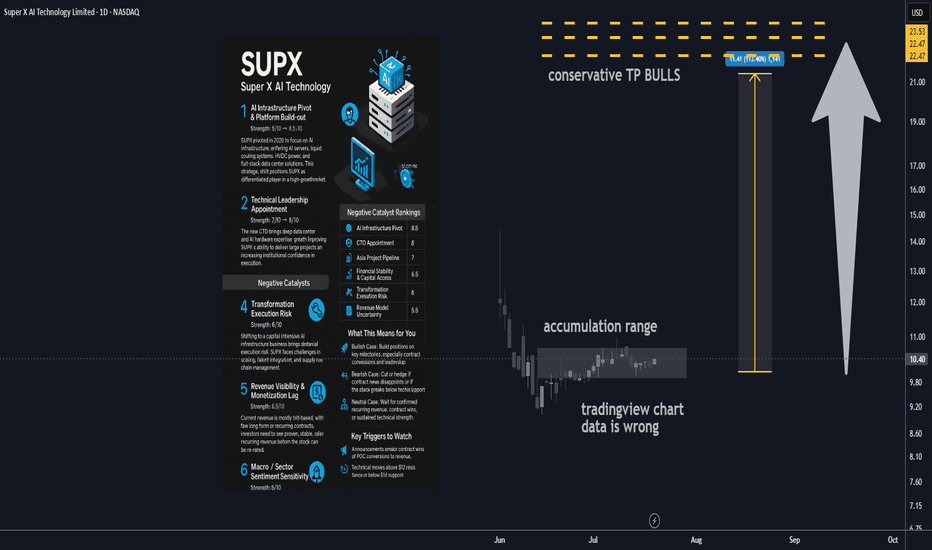
Expert🔋 1. AI Infrastructure Pivot & Platform Build-out Strength: 8/10 → 8.5/10 SUPX has made a major pivot in 2025, transitioning from a legacy business into next-gen AI infrastructure. The new focus includes AI servers, liquid cooling systems, HVDC power, and full-stack data center offerings targeting the rapidly growing demand for AI compute in Asia. This shift...
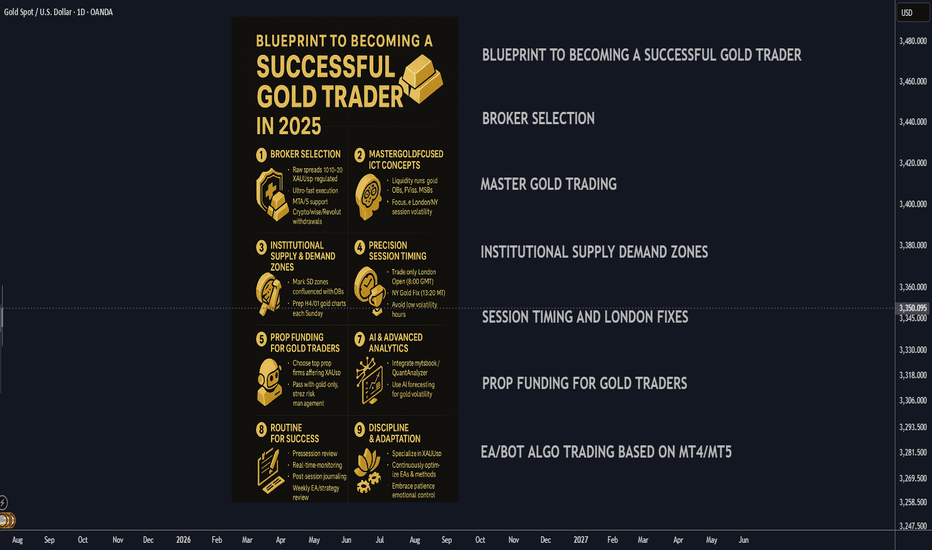
🚀 Blueprint to Becoming a Successful Gold Trader in 2025 A strategic, step-by-step plan to master gold trading by combining institutional concepts, cutting-edge automation, and the best prop funding opportunities for XAUUSD. ________________________________________ 🏦 Broker Selection (Gold-Specific) • 🔍 Choose Brokers Offering Raw Spread XAUUSD Accounts: Seek...
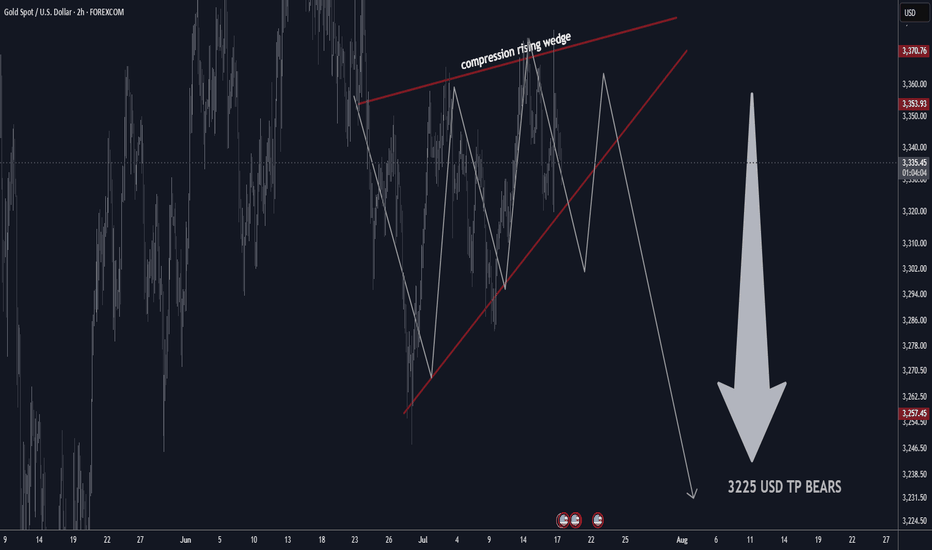
📊 Gold Technical Outlook Update – H4 & 2H Chart 📰 Latest Summary Headlines • Gold stalls near highs as technical compression signals possible breakdown • Bearish rising wedge on 2-hour chart hints at sharp move lower • Market volatility stays elevated amid global economic risks • Short-term sellers targeting $3,225 if wedge pattern...
🚀 Nvidia (NVDA) 2025+ Catalysts & Risks: Analyst Views 🔑 Key Catalysts Driving Nvidia’s Stock Growth (2025+) 1. 🏆 AI Chip Dominance Nvidia maintains >90% market share in data-center AI chips (Blackwell, Hopper, Rubin). Its CUDA ecosystem and relentless innovation keep it as the “default” supplier for advanced AI, giving NVDA massive pricing power. 2. 🏗️...
📉 Gold Holds Steady ~$3,354/oz Moderate USD strength and tariff-driven safe‑haven buying have kept gold anchored in the $3,330–$3,360 zone. 🤝 Trade & Tariff Influence Tariff headlines—from Canada’s 35% rate to broader threats—have supported gold by boosting safe‑haven demand heading into U.S. CPI. 📊 Technical Watch Testing resistance at $3,360; full...
________________________________________ Apple Outlook: July 2025–Q1 2026 After peaking near $200 in late May, Apple (AAPL) remains under correction territory despite pockets of resilience, closing July around $193. The current correction is projected to persist until Q1 2026, as global macro and policy headwinds weigh on the broader tech sector. Technicals...
Gold is stuck so far last 4-6 weeks in tight range trading conditions due to summer time seasonality also strong gains previously expecting range locked conditions in July as well here's an overview of 5 years and 10 years of seasonality data by month until at least August expecting dead market conditions it's best to focus on trading the range or trading with...
________________________________________ 🔬 10 Small-Cap Biotechs with Key Catalysts for 2025 July List ________________________________________ 1. Allogene Therapeutics (NASDAQ: ALLO) • Catalyst: Phase 2 data for ALLO-501A (anti-CD19 CAR-T for large B-cell lymphoma) expected in H2 2025; potential pivotal data could lead to regulatory submission. • Highlights:...
🔸Hello traders, let's review the 4 hour chart for GBPJPY. Strong gains off the lows recently, however price getting overextended and expecting reversal later at/near PRZ/D. 🔸Speculative XABCD structure defined by point X 199 point A 188 point B 195.20 point C 186.80 point D/PRZ 198.40/80 . 🔸Currently most points validated, point D/PRZ validated as well. Short...
Here's an updated/revised outlook for TSLA including all the primary catalyst ranking and analyst ratings and overview of latest developments 🔋 1. EV Demand Growth Strength: 9/10 → 9/10 Global electric vehicle adoption remains the dominant pillar. Tesla faces softer comp in Europe (–40.5% drop in May) wsj.com, but overall trend remains firmly upward. 🌍 🚗 2....
Gold Bull Markets: Long-Term Overview & Current Market Update (2024–2025) ________________________________________ 🏆 Historic Gold Bull Markets: Timeline & Stats 1️⃣ 1968–1980 “Super Bull” • Start/End: 1968 ($35) → 1980 ($850) • Total Gain: ~2,330% • Key Drivers: o End of the gold standard (Bretton Woods collapse) o Double-digit inflation, oil...
🏆 Gold Market Mid-Term Update 📉 Gold Pullback: XAU/USD drifted below $3,350, falling to around $3,325–$3,330 amid easing Middle East tensions and a firmer U.S. dollar. 🤝 Ceasefire Effect: De-escalation in Israel-Iran hostilities reduced safe-haven demand, capping gold’s upside. 💵 Fed & USD Dynamics: Fed Chair Powell reaffirmed that policymakers aren’t in a rush...
🔸Hello traders, let's review the 20 MINUTE chart for GBPAUD. Strong gains off the lows recently, however price getting overextended and expecting reversal later at/near PRZ/D. 🔸Speculative XABCD structure defined by point X 1000 point A 0700 point B 0930 point C 0640 point D/PRZ 1080 still pending. 🔸Currently most points validated, point D/PRZ still pending...
🏆USDJPY H2 Market Update H2 chart 📊 Technical Outlook 🔸trading in well defined range 🔸trading near range highs now 🔸range highs set 148.40/148.80 🔸range lows set at 140.80/141.40 🔸strategy: SHORT SELL from resistance 🔸SL 60 pips TP1 +100 pips TP2 +200 pips 🔸swing trade setup for patient traders 🌍 FX Market Snapshot — June 2025 🇪🇺 EUR/USD (~1.1500) Euro climbs...
AI Algo Systems vs. Manual Trading: Which Delivers Real Results? ⚖️ ________________________________________ Introduction With the explosive rise of artificial intelligence (AI) in financial markets, traders everywhere are asking the million-dollar question: Should I trust my trades to automation, or keep my hands on the wheel? 🧠🤖 This guide offers a real-world,...
Forex & Gold Market Highlights – June 21, 2025 🕒 Key Events This Week: • 🏦 Fed officials signaling possible rate cuts vs. cautious economic tone • 🌍 Escalating Israel–Iran tensions boosting safe-haven flows • 🏭 Mixed U.S. macro data (retail sales, Philly Fed, housing) shaping Fed expectations ________________________________________ 💶 EUR/USD Nears 1.1520 on...
With Mid East tensions rising and overall unpredictable situation around Strait of Hormuz, let's review potential scenarios for the Crude Oil Prices. I've outlined three scenarios with projected oil prices for each scenario below. 🚨 Market Alert: Israel-Iran Conflict Impact Forecast 📈 🔴 Worst-Case Scenario: Regional War + U.S. Military Involvement 🚢 Oil...
🏆 Gold Market Mid-Term Update (June 19, 2025) 📊 Price & Technical Outlook Current Spot Price: ~$3,365 Technical Setup Inverted H&S pattern forming/completed on higher timeframes — confirms bullish reversal structure. Reload (buy) zone: $3,250–$3,275 (ideal accumulation range for bulls if price pulls back). Swing trade setup: Entry: $3,250–$3,275 (reload...


