🏆 Gold Market Update (April 3rd, 2025) 📊 Technical Outlook Update ▪️5 wave impulse completed ▪️Expect correction now ▪️Tariffs already priced in ▪️Profit taking in progress now ▪️Price Target BEARS 2900/2950 USD ▪️Strategy: SHORT SELL rips/rallied ▪️target is 2900/2950 USD 📢 Gold Market Update – April 2025 📈 Gold Hits All-Time High! 🚀 Price spiked to...
🏆 EURUSD Market Update 📊 Technical Outlook 🔸Short-term: BULLS 1150 🔸Mid-term: BEARS 0670 🔸Status: REVERSAL from S/R 🔸0660/0680 normal pullback 🔸BULLS will max out at 1150 🔸Price Target Bears: 0660/0680 🔸Price Target BULLS: 1140/1160 📊 Forex Market Update – April 7, 2025 🇪🇺 EUR/USD 🔹 Reclaims the 1.1000 level amid fresh USD weakness 🔹 Driven by EU-U.S. trade...
🚀 Blueprint to Becoming a Successful Forex Trader in 2025: Leveraging ICT, Automation, and Prop Funding Here’s a detailed, actionable blueprint designed to position you for success by carefully navigating broker selection, adopting advanced trading strategies, obtaining prop funding, and integrating automation and AI technologies into your trading. 🏦 Broker...
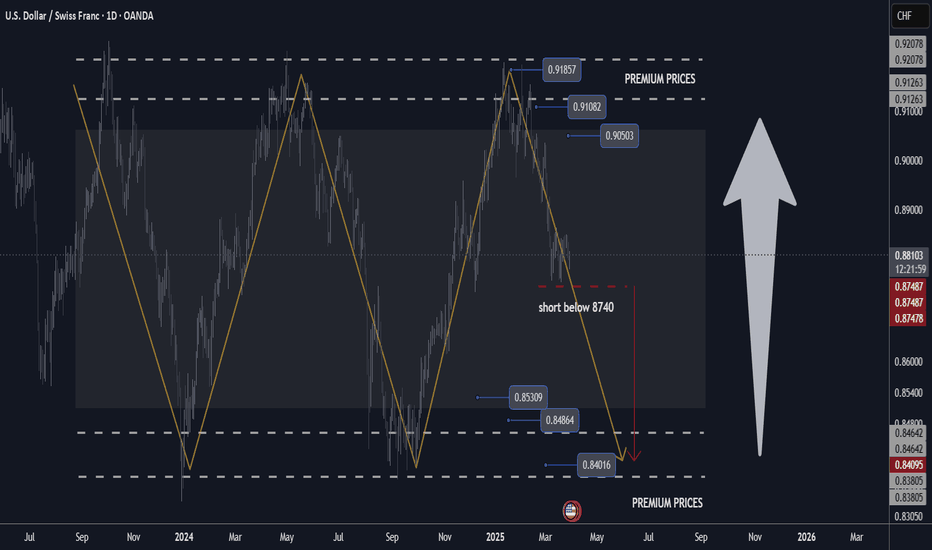
🔸Hello traders, let's review the D1 chart for USDCHF today. Price action contained within a well-defined range since September 2024. 🔸Premium prices at 9100/9185, below at 0225/0190. range highs 9050 and range lows set at 8540. trading mid range right now. 🔸Recommended strategy for USDCHF traders: break below 8740 exposes further downside, expecting dump. short...
🏆 EURUSD Market Update 📊 Technical Outlook 🔸Short-term: BEARS 0680 🔸Mid-term: BULLS 1180 🔸Status: pullback in progress 🔸0660/0680 normal pullback 🔸BULLS still maintain control 🔸Price Target Bears: 0660/0680 🔸Price Target BULLS: 1160/1180 📊 Forex Market Highlights – April 2nd, 2025 🚨 Traders await Trump’s “Liberation Day” tariff reveal at 20:00 GMT –...
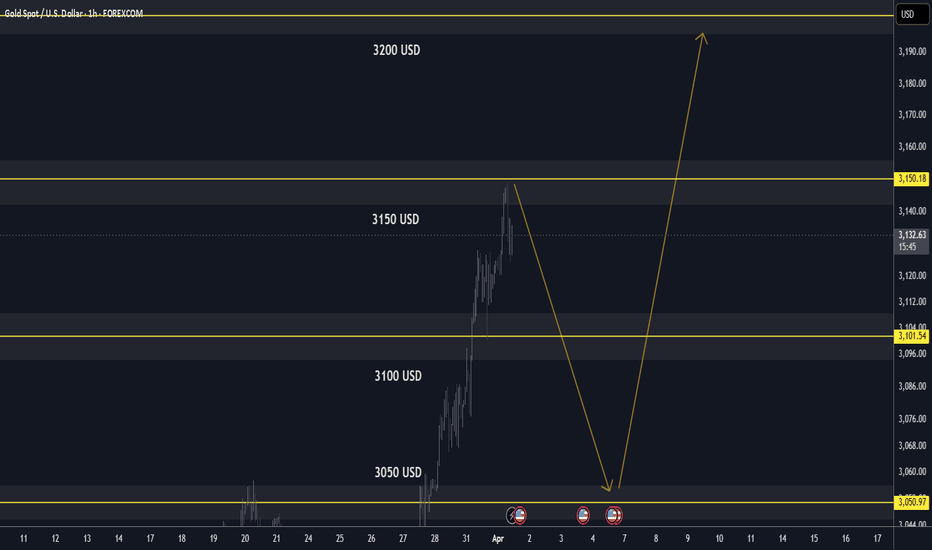
🏆 Gold Market Update (April 1st, 2025) 📊 Technical Outlook Update ▪️Bullish OUTLOOK ▪️Broke out and set new ATH ▪️Strong UPTREND: Sequence of Higher Lows ▪️Recommend to BUY DIPS at $3,050 USD ▪️Price Target BULLS: $3,150 USD - $3,200 USD 📈 Market Performance & Price Action 🚀 Gold Hits All-Time High: Surpassed $3,100 per ounce 📊 Driven by: Geopolitical...
🔍 ICT (Inner Circle Trader) is a trading methodology developed by Michael J. Huddleston. It focuses on market structure, smart money concepts (SMC), and how institutions manipulate liquidity to trap retail traders. 📚 It's not about indicators or over-complication — it's about reading the price action like a pro, understanding where liquidity is, and trading with...
📊 Technical Outlook update 🔸Bullish OUTLOOK 🔸3050 USD Resistance Heavy 🔸3000/3040 Trading Range 🔸2990 potential Bear Trap 🔸Price Target BULLS: 3100 USD - 3150 USD 🔸Recommended Strategy: BUY DIPS 2990 📊 Gold Market Summary – This Week 💰Gold Price Surge: Gold prices soared above $3,000, prompting Bank of America to raise its price target. 💸Profit-Taking...
🏆 eurusd Market Update / Wednesday 📊 Alternative Technical Outlook 🔸Bullish OUTLOOK 🔸5 waves Bullish Sequence on H12 🔸0230/0530 w1, 0530/0290 w2, 0290/0935 w3 🔸0935/0675 wave 4 pullback now 🔸0675/1100 - final wave 5 pump 🔸Recommend to BUY DIPS 0675/0665 🔸Price Target BULLS: 1100 USD in Wave5 💶📉 EUR/USD Mini Market Recap – March 2025 🔹 🛑 Fed Holds Rates 📉 No...
🔸Hello traders, let's review the 12 hour chart for EURUSD. Strong gains off the lows recently, however price getting overextended and expecting reversal later at/near PRZ/B. 🔸Speculative XABCD structure defined by point X 1140 point A 0240 point B 0935 point C 0425 point D/PRZ 1390 still pending. C also pending. 🔸Advanced short from point B targeting point C of...
🏆 Gold Market Update (March 24th 2025) 📊 Technical Outlook update 🔸Bullish OUTLOOK 🔸Broke out and set new ATH 🔸Strong UPTREND: Sequence of Higher Lows 🔸Recommend to BUY DIPS 2950 USD 🔸Price Target BULLS: 3075 USD - 3100 USD 📈 Market Performance & Price Action 🚀 Gold Hits All-Time High – Reached $3,057.21/oz this week 📊 Driven by: Geopolitical tensions +...
🧠 Forex Prop Trading: What Is It? Prop trading (proprietary trading) is when a trader uses a firm’s capital to trade the markets (instead of their own), and keeps a share of the profits – usually 70–90%. ✅ Low startup cost ✅ No personal risk (firm takes the loss) ✅ Big upside potential with scaling plans 📋 Step-by-Step Action Plan to Get Started (2025) 🔍 1....
🏆 eurusd Market Update 📊 Technical Outlook 🔸Mid-term: BEARISH OUTLOOK 🔸Status: pullback in progress 🔸Hit resistance at 0950 🔸0650/0660 normal pullback 🔸300 pullback off the recent highs 🔸BULLS still maintain control 🔸Price Target Bears: 0650/0660 🔸Price Target BULLS: 1100/1150 📊🔥 Latest EUR/USD & Fed Update 🛑 Federal Reserve Decision: 🏦 Fed Holds Rates...
🏆 Gold Market Update / Wednesday 📊 Technical Outlook 🔸Bullish OUTLOOK 🔸5 waves Bullish Sequence on H1 🔸2846/2930 w1, 2930/2887 w2, 2887/3045 w3 🔸3045-3055/2980-2990 wave 4 pullback now 🔸2980-2990/3100 - final wave 5 pump 🔸Recommend to BUY DIPS 2980/2990 USD 🔸Price Target BULLS: 3100 USD in Wave5 🏆🔥 Latest Gold Market Update – March 2025 🔥🏆 🚀 Gold Prices Hit...
🏆 BTC Market Update 📊 Technical Outlook 🔸Mid-term: BEARISH OUTLOOK 🔸Status: 40% correction in progress 🔸Potential V-shape recovery 🔸Similar fractal to 2021 🔸105 000 - 68 000 40% correction 🔸68 000 - 118 000 - 80% gains 🔸Price Target Bears: 68 000 USD 🔸Price Target BULLS: 118 000 USD 📉 Market Dynamics: 💰 BTC Pulls Back – Bitcoin corrects 🔻22% from its...
🏆 Gold Market Highlights (March 2025) 📊 Technical Outlook 🔸Bullish OUTLOOK 🔸Broke out and set new ATH 🔸Strong UPTREND: Sequence of Higher Lows 🔸Recommend to BUY DIPS 2925/2950 USD 🔸Price Target BULLS: 3050 USD - 3100 USD 📈 Historic Milestone Achieved 🏅 Gold Futures Surpass $3,000 🔥 Gold prices hit an all-time high, closing above $3,000 ATH 🚀 Major breakout in...
📉 **EUR/USD Weekly Outlook Update** 🔹 **Downtrend Intact**: The **EUR/USD** downtrend has been well-defined since **2009**, and a recent **strong rejection** after a period of distribution confirms bearish momentum. 🔹 **Technical Target 🎯**: - **Short-term Outlook**: EUR/USD is set to hit **0.95** by **summer 2025**. - **Year-End Projection**:...
📊 Market Structure: Uptrend vs. Downtrend 🔼 Uptrend Market Structure (Higher Highs & Higher Lows) Price makes higher highs (HH) and higher lows (HL). Indicates buyers are in control. Traders look for buying opportunities at key support levels. Example Structure: 📍 HH → HL → Higher HH → Higher HL (trend continuation). 🔽 Downtrend Market Structure (Lower Highs &...


