Pushpmegh
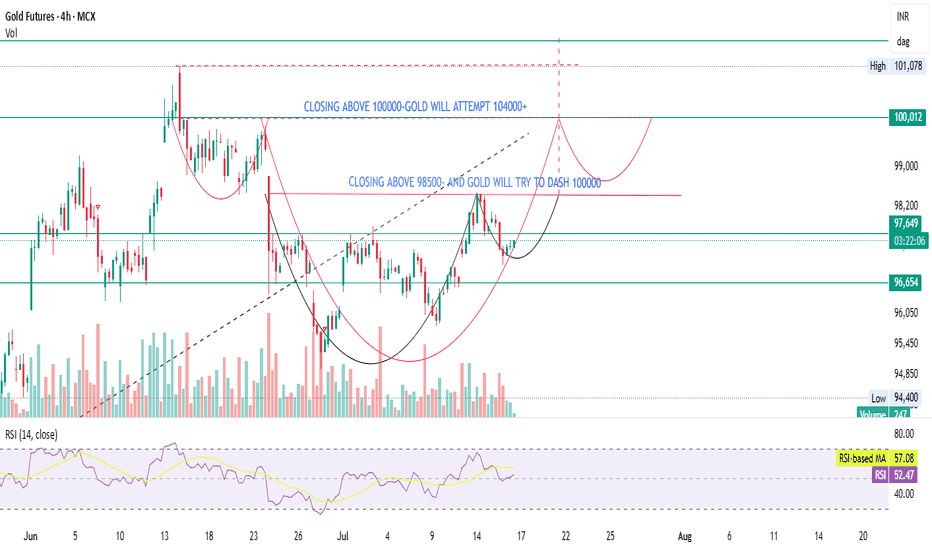
Gold is forming a bullish structure, but a confirmed breakout above ₹98,500 (on volume) is essential for momentum toward ₹100,000. If ₹100,000 is broken with strength, ₹104,000+ is a reasonable technical target. RSI is neutral, allowing room for upside. Watch for a volume spike and confirmation candles before entering.
simple price action says everything on the chart- 200 is indeed looking good- track tata steel.
📊 Summary: Deepak Fertilizers has successfully broken out of a Cup and Handle pattern with a weekly close above ₹1450, confirming a strong bullish trend. RSI supports the move, and price action aligns with classic breakout behavior. 🔍 Technical Breakdown: Pattern: Cup & Handle formation – bullish continuation setup. Breakout Zone: ₹1450 breached on weekly...
Chart Overview: Timeframe: 4H (MCX) Current Price: ₹95,524 Volume: 1.6K Trend: Short-term bearish 📉 Observations: 1. Break of Support Zones: Multiple support zones have been drawn on the chart: Around ₹96,200, ₹94,700, ₹91,800, and finally near ₹86,600–82,200. Price is now trading below the ₹96,200 support, showing clear weakness. 2. Structure: This looks...
High at ₹175.35 marked — confirmed historical resistance. Fibonacci 0.618 retracement level at ₹69.68 — acted as a key support in the past. Important demand zone retest (marked in purple) was successful and led to the current uptrend. 2. Bullish Trap Highlighted: The marked "Bullish Trap?" zone shows a classic false breakout above previous highs, followed by a...
Stock: Sheela Foam Ltd Chart Type: Weekly Current Trend: Reversal from C-wave bottom, after long ABC correction. Support: Strong base at Fib 0.786 (₹813.20). Volume: Surge near point C adds confirmation. RSI: Rising above 50 from oversold — bullish momentum starting. 📊 Resistance Levels: R1 (₹1040–₹1150): First test of structure R2 (₹1450–₹1550):...
Fibonacci Extension Levels: 1.0 = ₹365.75 (key breakout base) 1.618 = ₹1,011.95 (potential target) Horizontal Support: Around ₹365–₹370 (marked by prior structure & 1.0 Fib level) Descending Trendline: Broken recently — this breakout indicates short-term reversal from downtrend. Volume Spike: Circled area indicates high volume + price bounce = potential...
✅ Pattern Recognition & Price Structure: Cup and Handle Formation: Two distinct cup-like bases are forming a larger “Double Cup & Handle” structure — a strong bullish continuation pattern. First cup (2020–2023): Already completed with breakout above mid-point neckline. Second cup (2023–2025): Currently approaching breakout zone. 📌 Key Levels: Major Resistance...
🔍 Wave Structure Analysis (Elliott Wave Count): The chart follows a classic 5-wave impulsive structure: Wave i → ii → iii → iv → v (subwaves of primary wave 1). Wave (ii) retraced ~38.2% of Wave (i), showing healthy correction. Wave (iii) extended well, with internal sub-waves clearly marked (i, ii, iii, iv, v). Current move is likely Wave v of 1, still in...
The chart displays a bullish impulse wave structure, with clear labeling of waves ① to ⑤ (sub-waves) and i to v (main impulse structure). Here's the breakdown: 🔹 Wave Structure Wave ① and ②: Wave ② retraced to around the 0.382 Fibonacci level (94,054), which is a healthy correction. Wave ③: A powerful rally exceeding wave ①. Internally subdivided into 5...
✅ Elliott Wave Count (Verified & Explained) The chart presents a classic 5-wave impulsive Elliott Wave structure: Wave 1: Initial rally, confirmed by a clear breakout. Wave 2: Deep retracement to ~0.786 Fib (around ₹106.95) — valid corrective wave. Wave 3: Strong rally to ₹318.15 — the longest wave, typical of Wave 3. Wave 4: Corrective phase, consolidating...
Trend & Structure: Price has broken out of a long-term falling trendline, indicating a potential trend reversal. Immediate resistance at ₹65 has been cleared, suggesting bullish momentum. Breakout level is marked and retested, forming a higher low, adding confirmation to the uptrend. Volume: Breakout is accompanied by rising volume, a positive sign of...
ALKEM LABORATORIES – Weekly Elliott Wave View The chart presents a clear 5-wave Elliott impulse in progress. Wave 4 appears to be completed or near completion, resting at the golden 0.618 Fib level of Wave 3. The broader uptrend remains intact inside the long-term channel. Key Levels: Support: ₹4,475 – ₹3,956 Resistance: ₹5,272, ₹6,439, ₹6,700, and ₹8,407...
The structure suggests a completed Wave 4 correction at 0.5–0.618 Fibonacci retracement, setting up for the final Wave 5 leg. A bullish reversal is underway, supported by improving RSI and rising volume. Key Levels: Support: ₹603, ₹500, ₹465 Resistance: ₹725 (Fib), then new highs RSI at 42.6 shows early bullish momentum. A weekly close above ₹725 could confirm...
📊 Summary: A cup and handle pattern appears to have broken out but is now retesting the breakout zone. Price is hovering around support at ₹74–75, but weakness is creeping in, with RSI below 41 and declining momentum. 🔍 Technical Insights: Pattern: Classic Cup & Handle breakout, but failed to sustain. Trendline Breakdown: The upward sloping trendline has been...
📊 Summary: After breaking out of a falling wedge, Hindustan Motors is currently in a consolidation phase near resistance zones. A range breakout above ₹35 with volume could open the doors for a bigger rally, while ₹27 acts as immediate support. 🔍 Technical Breakdown: Pattern: Falling Wedge breakout followed by sideways consolidation. Current Price:...
📊 Summary: CreditAccess Grameen has shown a strong recovery from the ₹800 zone and is forming a rounding bottom pattern, suggesting the potential start of a long-term uptrend. The long-term channel from 2020 remains valid, and price is gradually making its way toward the upper range. 🔍 Technical Breakdown: Structure: Rounding bottom formation underway. Long-term...
🔍 Summary: Chemplast Sanmar has been in a prolonged downtrend after peaking near ₹750. Price recently respected key Fibonacci retracement zones and horizontal support near ₹420. Currently, it is attempting to break a falling trendline, with RSI also showing early signs of strength. 🔍 Technical Breakdown: Trend: Downtrend since July 2023 with consistent lower...


