RCtrader2
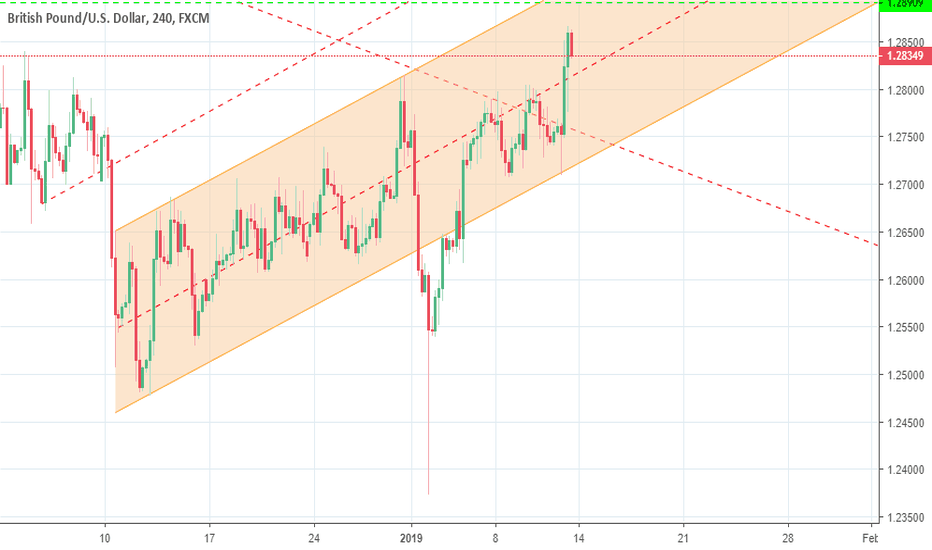
An uptrend channel developed on the 4h chart that can be used for successful entries for either longs or shorts. Main horizontal resistances are in the ~1.2890 area and the ~1.3040 area respectively.
The promise for a greater America than before might be broken this year. The EURUSD pair has developed an uptrend channel on the 4h/daily chart and might be developing a cup and handle pattern on the weekly chart. Trading switched once again to easy mode with clear entries for either shorts or longs.
It appears there is an uptrend and so I draw the chart to what could be the limits of this uptrend channel. Trade Plan: Entry: 0.7200-0.7260, TP1: 0.7300, TP2: 0.7380, SL: 0.7160
Trading Plan: Short, entry 1.1380-1.1430, TP 1.1220, SL 1.1510 Long, entry 1.1220-1.1240, TP1: 1.1310, TP2: 1.1414, TP3: 1.1520, TP4: 1.1720, SL: 1.1180 Comment: Based on historical price action.
On the chart, you see the 5 EWs and ABC corrective waves. The cardinal rules are not respected. I would rather have more bouncing in the 1.1300 - 1.1480 area.
Trade Plan: Long, entry 1.1430, TP1: 1.1500, TP2: 1.1610, TP3: 1.1742, TP4: 1.1818, SL: 1.1400 Short, entry 1.1274, TP1: 1.1224, TP2: 1.1160, TP3: 1.1050, TP4: 1.0880, SL: 1.1305 Note: The price could make a breakout either up or down.
Trade Plan: Sell, entry 1.2580, TP1: 1.2480, TP2: 1.2350, TP3: 1.2220, SL: 1.2610
The pair has been in a downtrend for the past 8 months. The trip start and endpoint is a 1250 pips long segment and it's not certain yet if it is to stay like this. There have been plenty of times to break this downwards move but the tide did not loose steam. It is perhaps now when the price stands at a crossroad and thus our chance to monitor that closely.
The ascent is very steep, so I used a 2h chart to lay down the possible limits of the uptrend channel. The MAs on the 1h/4h chart are bullish, but a possible bearish harmonic pattern on the 4h chart has to be cleared out. You can use the chart as a guide to day trading.
The Aussie bliss continues with a new prime-minister being sworn in, the 5th in the last 5 years. This marathon* that lasts for more than a decade is a tale of a third-world country rather than an OECD member. It is said that there are more people on the streets than there were in the last 60 years. The interest rate is at a record low but borrowing costs are...
Trading Plan: Long, entry: 1.26-1.30, TP1: 1.3220, TP2: 1.3600, TP3: 1.4000. SL: 1.2590
Trading Plan: Long, entry - 1.1310, SL: 1.1247, TP1: 1.1720, TP2: 1.1842, TP3: 1.1980
Trading Plan: Buy USD/JPY, entry 111.200 - 112.600, TP1: 114.000, TP2: 117.000, SL: 111.000
Trading Plan: Sell, Entry 1.1639, TP 1.1532, SL 1.1649
It is running towards the 1.15x area again. The lines on the chart are divided into leading and supporting roles. In the next 30 days, it might dance inside the expanding triangle.
Trading Plan (13/Sep/2018) Short, TP1: 1.1501, TP2: 1.1454 Long, Entry 1.1400 - 1.1500, TP1: 1.1720, TP2: 1.1750
The pair has exited the uptrend channel and is now headed towards 1.13x. It would be the 3rd impulse wave on the daily chart (5-3 EW) which has finished or is about to finish the 1st impulse wave on the lower TF (4h for example). If this scenario is true then the 2nd corrective wave is rather short compared to the 1st corrective wave. Our aim, however, is to be...
Trading Plan: Short Term: Sell until 1.2690, TP at 1.2681, SL 1.3050 Short Term: Buy below 1.2681, TP1 1.2800, TP2 1.2850 Long Term: Sell, TP at 1.2022


