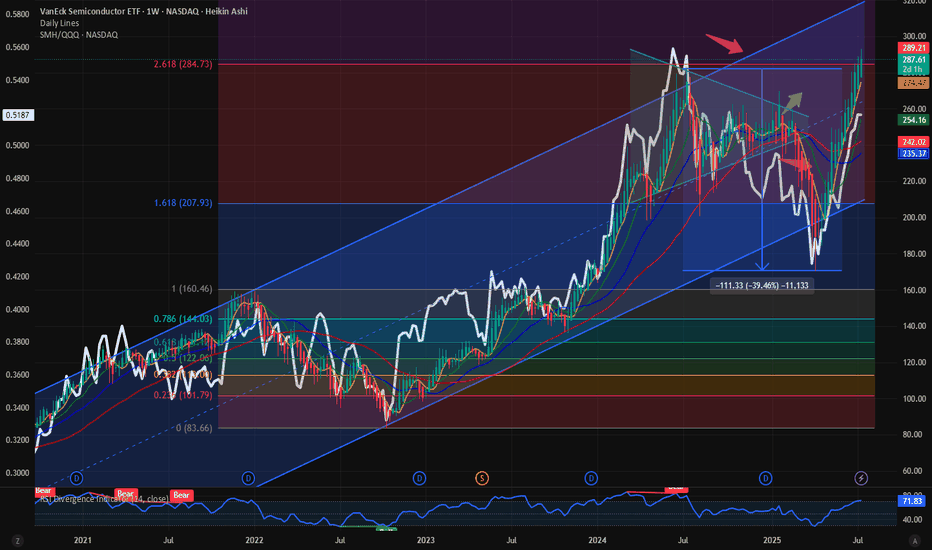
It’s the semis which are the hallmark of a cyclical bull market. It is always the Semis which indicate the start of a bull market and the first to fold over towards the end of a cyclical bull market. Hence the outperformance of Semis as a momentum sector is important from a symbolism perspective and from a market indicator perspective. When the semis outperform...
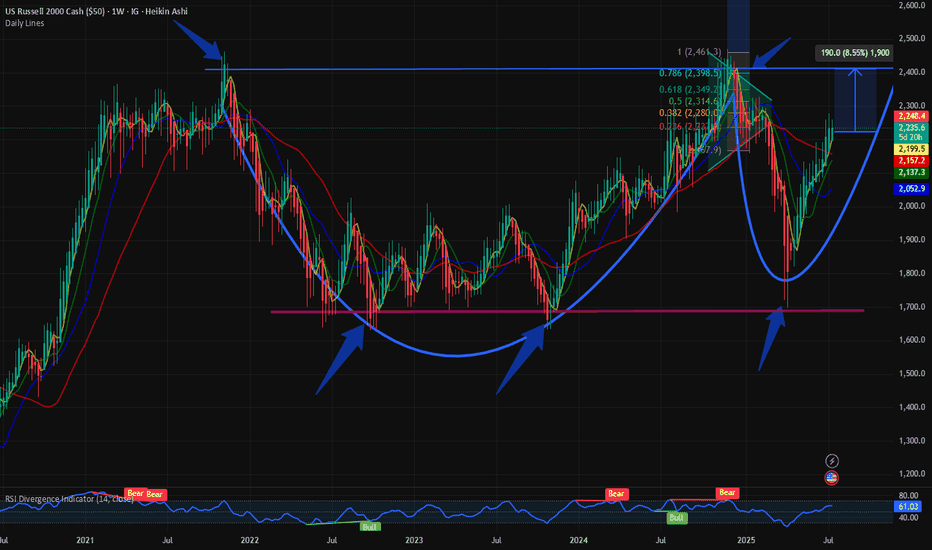
The small cap index $RUSSEL has had a good past couple of months and has bounced back from its lows. We visited the small cap index on May 1st when we identified the trend reversal. The $RUSSEL was in the recovery mode after the Liberation Day capitulation. IG:RUSSELL in a bounce back mode. But upside is capped @ 2400 for IG:RUSSELL by RabishankarBiswal —...
With NASDAQ:NVDA and NASDAQ:SMH above their respective ATH the focus returns to the fact how far we can expect for both to outperform and make new highs. In this Blog we floated the idea of NASDAQ:NVDA dominance. This indicates the % of return / price movement in NASDAQ:SMH contributed by NASDAQ:NVDA as it is a cap weighted index. It captures the...
Time and again we investigate the CRYPTOCAP:BTC dominance chart. In my opinion it is the most important chart in the Crypto markets. I have supported the idea that we will see CRYPTOCAP:BTC.D touch 66% in this market cycle. In my first blog on this topic on April 14th I published the idea here in Trading view. CRYPTOCAP:BTC.D to 66%, CRYPTOCAP:TOTAL2 /...
In this bull market where almost all the stocks are working, NASDAQ:TSLA seems to be still in the penalty box. When NASDAQ:NVDA , NASDAQ:MSFT are at ATH and most of the Mag7 are near to the ATH. NASDAQ:TSLA is still 33% below its ATH of 484 $. And the price action is not particularly bullish. This week NASDAQ:AVGO crossed NASDAQ:TSLA with a larger...
Here we are again with one more TVC:DXY chart analysis. I think the US Dollar does not fail to surprise us week after week. Making new lows every week is giving a boost to the Equity markets. The SP:SPX and NASDAQ:QQQ are at ATH. In my articles on April 18 and June 16 Perfect trade setup: AMEX:GLD to 325; DXY to 95 for AMEX:GLD by RabishankarBiswal ...
In the crypto space we time and again regularly focus on the CRYPTOCAP:BTC and the CRYPTOCAP:BTC.D chart and we have time and again predicted that CRYPTOCAP:BTC.D will touch at least 66% in this Crypto cycle. This CRYPTOCAP:BTC Dominance can be interpreted not only as the CRYPTOCAP:BTC superiority but the weakness of Altcoins. Most of it comes from the...
Before you wonder why we call it a Teflon stock please check my blog on 27 April 2025. NASDAQ:MSFT : A 'Teflon' stock refusing to budge under pressure for NASDAQ:MSFT by RabishankarBiswal I pointed out the reason why this stock refused to go down below critical levels and held onto some impressive gains. And since then, we have rallied 33% from the lows of 360...
In this summer bull market, it makes more sense to talk about the large cap winners. NASDAQ:NVDA chart is a beauty to watch with the steady climb of this mega cap stock levitates all the indices including S&P500 and NASDAQ. After hitting 90$ during the Liberation Day drawdown the stock is 60% up since then and recovered all its losses and hitting a new ATH. With...
Today I will go unconventional in my analysis and look at the yields of 3 major economies with 3 different fiscal trajectories. Today we look at the 10Y Yield of US, Germany and Switzerland. 3 different countries with different Fiscal and Monetary policies off late. The TVC:US10Y after touching the highs of 5% in Oct 2023 has been in a downward trend making...
This week we officially recovered all the losses from the liberation day low. We had a 20% bear market crash and since then there has been a V shaped rally in the major averages. NASDAQ:QQQ and SP:SPX have fully recovered the losses and then some. It is 0% form its ATH. We have been closely following the chart of SP:SPX for the last few weeks and have marked...
To understand the investor positioning in the Crypto markets we must understand the CRYPTOCAP:BTC values of the Altcoins. In terms of USD the valuations might go up but if we look at the pair trade of the Altcoins relative to CRYPTOCAP:BTC we can relay understand the flow among the various Cryptocurrencies. Let’s understand the relationship between ...
With all the volatility in the capital markets, Crypto is not immune to such swings. IN this space we have time and again analyzed the charts and have indicated that the best bet in the Crypto is to stay with CRYPTOCAP:BTC in these turbulent times. Even if CRYPTOCAP:BTC is above its previous cycle highs, this cannot be said about many altcoins like ...
The poster child of the AI rally has been NASDAQ:NVDA and $AVGO. Here we have analysed both the stocks multiple times fundamentally and technically. But the lesser known NASDAQ:AVGO has performed better than the NASDAQ:NVDA since the April lows. NASDAQ:AVGO is still above its previous ATH and closed above yesterday which was 242 $ in Jan 2025. NASDAQ:NVDA...
The recent weakness in TVC:DXY is well documented. We have analyzed it here in detail in our blogs. This weakness is giving wings to all kinds of risk assets including Ems. One of our favorite EM in this space has been India and NSE:NIFTY index for quiet some time. It is the only EM which is close to beating S&P 500 over the last 5-year period. We have been...
Today we dive into the world of crypto. We are looking into the recent rally in the Altcoins including CRYPTOCAP:ETH and §Sol and try to understand the reasons behind it and what is means for the future. CRYPTOCAP:TOTAL2 depicts the total market capitalization of all the Altcoins except CRYPTOCAP:BTC but including stable coins. When in doubt, zoom out. Today...
In this blog space we focus a lot on the AI trade. Be it semiconductors, AI powered Cybersecurity, AI Powered Fintech or just the industry itself, but we have not quietly focused on the AI Software stocks. The second and third derivatives of the AI trade will be more on the software space than Semiconductors where most of the future value will be accrued. Now...
Many will say not all industrials are created equal. Some stocks give more α- than others. Within the SPDR Industrial subsector ETF AMEX:XLI we have stocks like Boeing which have done nothing for the last 5 years. On the other hand, we have midcap industrial stocks like NYSE:PWR , NYSE:TT and NYSE:GEV whose chart looks amazing and has clear uptrends. What...


