Rainman2
Continuation of the Big W Fractal Charts
As you may have guessed, I always go big...
Forget my previous everything. I am not joking people!!!! We are about to explode! If I end up right (oh, god please let me be right), and enough people start following, I'll tell you how I got to this conclusion. Peace out!
But seriously, you should stay out of the triangle. A lot of things happening here. Bitcoin is one fickle mother f#$%#, and right now we're still inside of a symmetrical triangle going sideways. The sideways action will more than likely last for a few more days, with a break in either direction. As you can see on the chart, I've outlined the possible paths...
This is a continuation of the ETH What to Expect for the Next 2 Weeks chart, which has been fairly accurate so far. The fractal patterns I've been tracking have started to overlap with no clear distinction between the end of one pattern and the beginning of another. All I can say for sure is that those patterns, namely the Big W (Adam and Eve Double Bottom)/3...
Seeing as my 50% target was met ahead of schedule, here are your new targets. Enjoy!
Two possible scenarios based on this past week as well as the movements of Bitcoin and other cryptos.
Remember me? Yea, it's the guy who called this bull run before anybody else. Here I provide a roadmap for how Bitcoin gets to 12k. Follow or like to get the latest updates.
I think that the blue up slanting Inv H&S is a real possibility. Should that not happen and we get the down slanting inverse H&S instead, it will fail at the right shoulder, and we will have confirmation that we are inside of a much bigger symmetrical triangle.
70% Jump in the next week to two weeks, followed by an equally dramatic drop down. There is a chance that the sharp drop afterward will bring the price below the triangle, although I don't think that will be the case. Rather if you were to draw an arc that contains all of the jagged edges of the descent from the 2017 high, it should hug that curve and gyrate...
I've outlined the possible drop-down areas for ETH. One of them is right now. Watch for the price hits at those target red arrows, you want to pay close attention to what's happening at those times.
Based on previous price action, this is the most likely path.
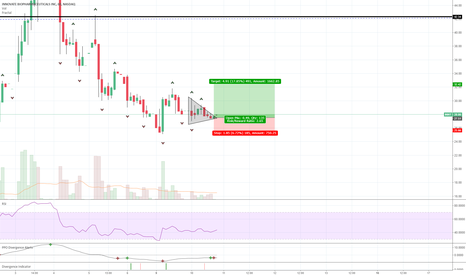
INNT is now in the consolidation phase of the Big W pattern. This phase generally creates a triangle pattern, usually a symmetrical triangle, although a descending wedge is also possible. The symmetrical triangle formed by INNT is almost at its exit point. Once that happens, expect a sharp jump up, at minimum 20% today. Unfortunately, that jump up creates an...
Cup and Handle formation developing for Ripple. Note that the retrace back from the initial jump will be less drastic than with the coins completing an Inverse H&S. Ripple will be completing its own gigantic Inverse H&S formation at some point. The arch of the cup will create the head of that pattern.
We've already hit bottom, stop selling your mother f$%^ coins! I can't make this any easier to comprehend...


