CAPITALCOM:US100 The Nasdaq 100 has moved up impulsively on a 5-wave move over the past 6 weeks, which is very bullish long term. However, in the short term, it is overextended, with the RSI indicator over the 70 level. I expect it to decline over the next couple of weeks to the area marked in the green rectangle, between the 50% and the 78.6% Fibonacci...
BINANCE:ETHUSDT Ethereum has moved up strongly in the last 6 weeks to a key resistance level, which is the 50% Fibonacci Retracement, leaving a huge Fair Value Gap between the $2,400 USDT and the $1,900 USDT level. Most Fair Value Gaps get filled, and I expect it to be the case this time. The Gap closes at around $1,900 USDT. I also see this move overextended...
BINANCE:BTCUSDT Bitcoin has moved up strongly in the last 5 weeks in a 5-wave up move, which is very bullish long term. However, after a 5-wave move, there is usually a 3-wave corrective move to the opposite direction. The most common target will be the Golden Pocket, which is between the 61.8% Fibonacci Retracement and the 78.6% Fibonacci Retracement. Which...
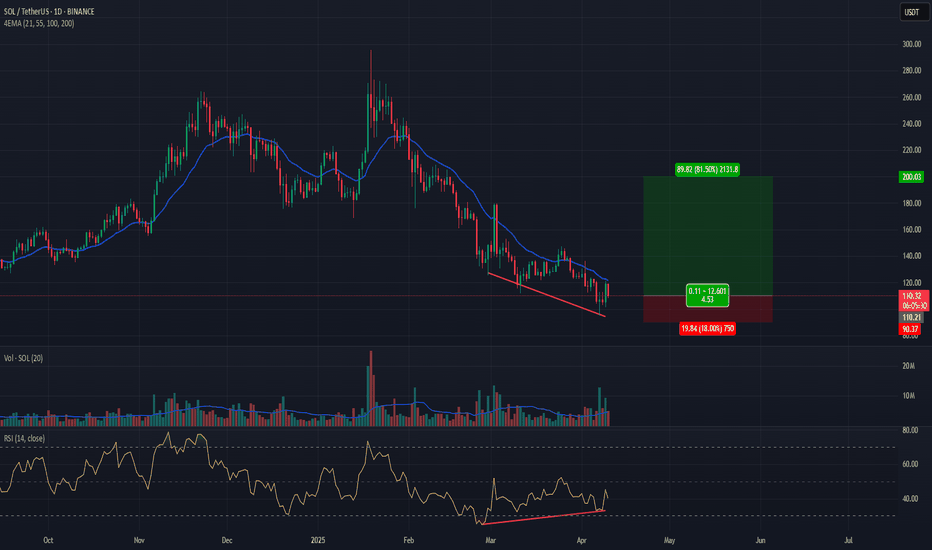
BINANCE:SOLUSDT Solana has experienced climatic volume to the downside, bullish RSI divergence, and now it seems ready for a big bounce. Also, there is a Hammer candlestick at the bottom of the decline. Good luck to you
BINANCE:BTCUSDT Bitcoin has made a 5 wave move to the downside, it is forming a bullish RSI divergence on the 4-hour chart, it already shown climatic volume on the recent bounce, seems like downside should be limited from here in the short to mid-term. Long term, the trend is still down. I expect a multi-week bounce from here, probably to the 50% retracement,...
BINANCE:BTCUSDT Bitcoin put a massive Bearish Engulfing Candle yesterday, with high volume, which is very bearish, and now I’m expecting it to continue to decline. It also tends to follow the US Indices, which are heading lower. My target is about 70k, maybe even lower. Good luck to you
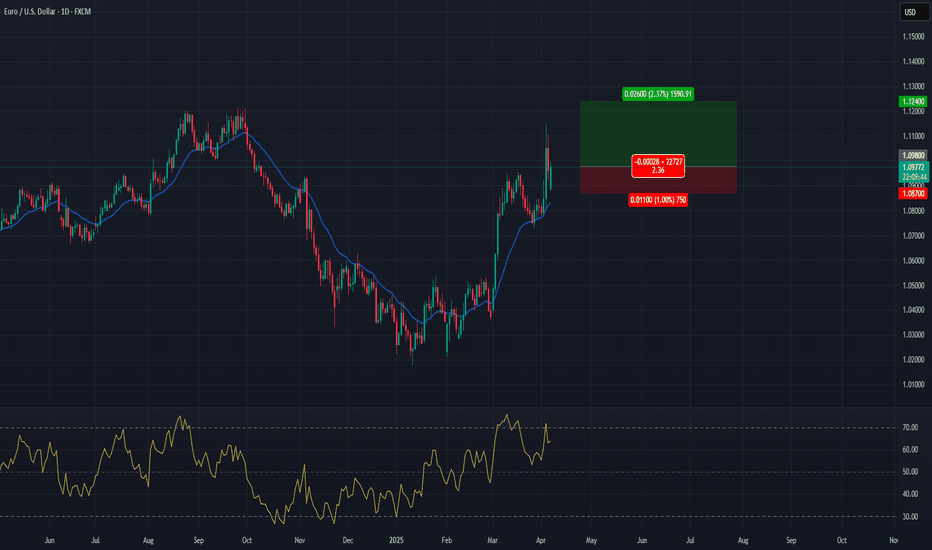
FX:EURUSD The trend is up, has gapped down to support area and bounce back, still looking like it could continue higher. Going in with a tight stop, looking to make a quick profit next week. Good luck to you
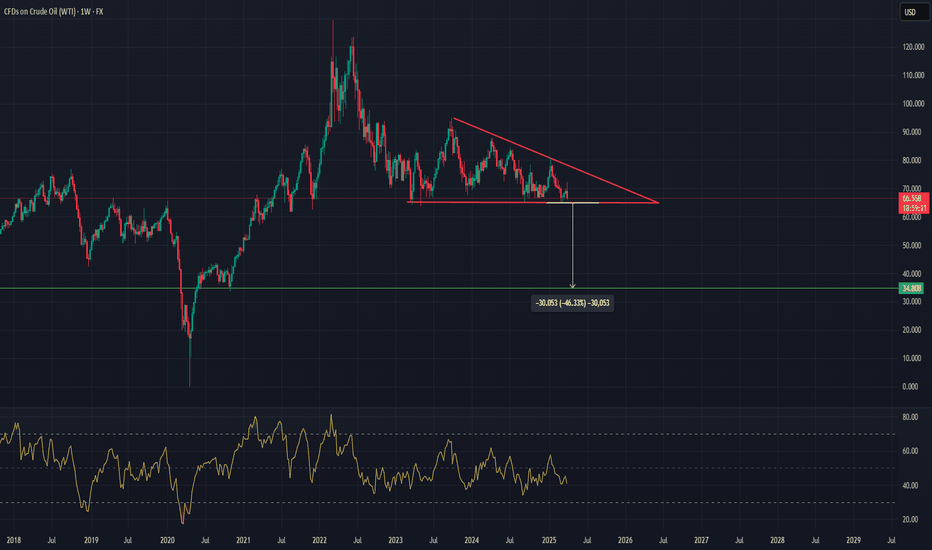
PYTH:USOILSPOT Oil has been in a multi-week declining triangle pattern, lasting over 2 years so far, which will eventually break to the downside. When it does, the price target should be around $35 USD. Which is calculated subtracting the width of the triangle from the base of the triangle. When? Probably when we have a stock market crash, which could be soon....
PEPPERSTONE:US500 The S&P 500 broke below critical support after Trump announce massive tariffs on everyone, worst than expected. Volume is increasing to the downside, and it looks like the next wave down has already started. Wave C is supposed to be equal or larger than wave A, and reach the next critical support, which will lead us to 5,100 points in the...
NASDAQ:TSLA Tesla has reach and bonce from a key support level, as seen on the chart, in the Golden Pocket, between the 61.8% and the 78.6% Fibonacci Retracement, and it is shown two weekly hammer candlestick bar near each other, which is bullish. Odds that it has already found a mid-term bottom is high. Now I expect a multi-week bounce from here, probably to...
BINANCE:ETHUSDT Ethereum has declined to a critical 61.8% retracement level, and even grab liquidity below previous area of support, RSI is near oversold levels. Previous up move is in a 5-wave move, while current decline is in a 3-wave move. Going long here, not a recommendation, with stop below the 78.6% FIBO retracement, and target at all-time high. Good...
BINANCE:ATOMUSDT ATOM apparently is making an Inverted Head & Shoulders Pattern on the daily timeframe. To confirm it, it needs to break above $5.20 USDT. If it does, the price target would be about $6.80 USDT. To deny, it needs to break below $4.00 USDT. Good luck to you
BINANCE:BOMEUSDT Bome has gone up in a 5-waves move, Leading Diagonal Pattern, and retrace to the key level of 78.6% Fibonacci Retracement, it is on the exact place where you should expect a bounce. And after 5 loosing days, it seems like we are making a bullish Harami Candlestick. Risk-Reward ratio is huge here.
FX:EURUSD The EURUSD is in the key Fibonacci Retracement level of between the 78.6% and 88.6% levels, volume is starting to decline to the downside, we have almost a complete 5-wave move, and we have a positive RSI divergence reading, after it reach oversold levels. Nice Risk-Reward ratio here, even if it manages to sweep the lows a little bite.
BINANCE:FTMUSDT As you can see in the chart, it looks like we are confirming an Inverse Head & Shoulders Pattern on the Fantom Token (FTMUSDT). To confirm it, we will need to break above $0.54 USDT, and if we do, it will give us a price target of $0.85 USDT. If you buy it from here, is more than a 100% return. Stop should be at the bottom of august 5,2024 at...
PEPPERSTONE:US30 It may go down a little further, but it is now in the support zone. Looking for a swing trade here to about the 61.8% Fibonacci Retracement. RSI is oversold.
FTX:APEUSD APECOIN seems to have top-out with the RSI indicator extremely overbought, and now it is pointing down. It seems to have made a Falling Wedge Pattern, which is a bearish pattern, and about to break to the downside. I’m going short here, with stop above August 5 highs. Not a recommendation. Good Luck to You
BINANCE:MATICUSDT Matic place an important top on July 31, by making a huge Shooting Star Reversal Pattern that day. It is making another smaller one today. In Elliott Wave Terms, the up move seems corrective. MACD Indicator has given a sell signal, something that didn’t happened before for about 39 days, with the blue line crossing below the orange...


