RayGunaraj
EssentialHave updated the counts since my last post. I believe we have a series of ones and twos since the 15th May low... Once we start moving into the third of the third of the third, US Indices will commence either a correction or another bearish leg. Have been long Gold and will be holding my positions.
the decline from the 22nd of April is in a very clear 3 waves with a perfect 100% retracement. the subsequent rally from the 15th of May is in a clear motive sequence. negative RSI divergence signals that some sort of 5th wave is complete. the characteristics of this motive rally seems like a wave (i) of V is complete and we are now looking for a drop to...
I have been bearish on the Russell for a long time. nothing has changed. the wave count is getting clearer... at least for now. price action as of late has been like watching paint dry on the wall, still waiting for a catalyst... coming soon, i believe. this count would only be invalidated with a sustained break above resistance zone. **minor change from my...
Wave (ii) is still in progress. Slight update to the primary wave count from the previous one below. 200 & 100 SMA's are sloping firmly to the downside therefore I will continue to keep selling at technical levels. Late May or early June would be a good time to go long... Support levels are shown in green.
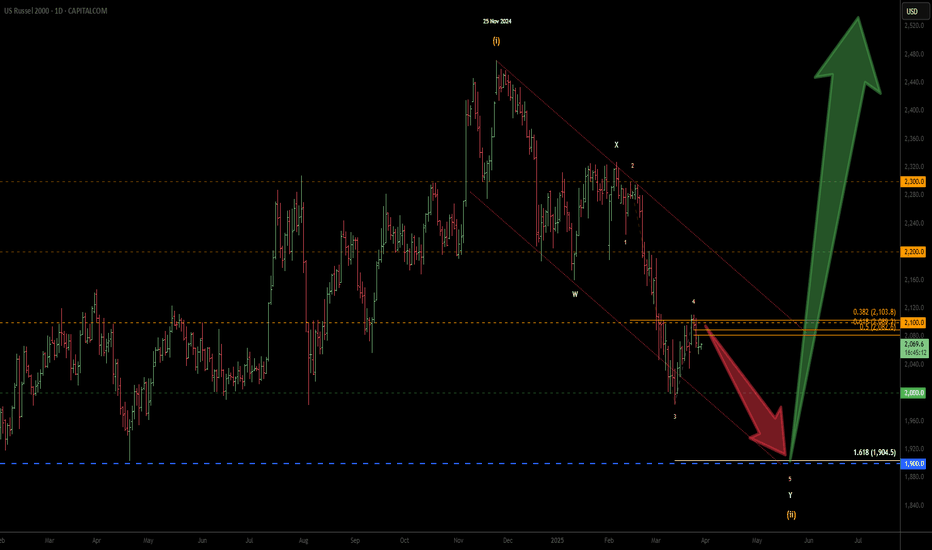
Looking for the double zig zag correction to complete (Y) leg in the blue zone. Will be looking for five waves to the downside for the target. Updated the wave count from my previous chart below... This drop from the 25th November 2024 to the expected target zone would be more or less similar to the Covid drop in terms of percentage.
The rejection at 2100 price level also happens to be the 38.2% Fib of the decline from the 14th of February 2025. The decline from 6th of February 2025 counts beautifully as waves 1, 2, 3 & 4. If this wave count is correct, then the Russell is currently in wave 1 of 5 of Y of (ii). This is my primary wave count as long as the 2100 resistance is not...
Shorts were good while it lasted... looks like a good time to buy pullbacks. It would be wise to wait for a clear 3 wave correction though. Elliot Wave Analysis shows a larger degree wave IV was completed in March 2020. Since then, the Russell 2000 has been nesting within a bullish rectangle chart pattern, possibly working its way up to the larger degree wave...
Possible wave (ii) complex correction in the form of a WXYXZ still in progress. Expecting corrective rally to fail around the 2200 resistance zone. A final wave down from there should find a bottom around the 1900 support zone where wave (ii) should end. Expecting wave (iii) to commence from there... ------ *would appreciate feedbacks and thoughts on...


